What Is Data Modeling? A Beginner’s Guide for Excel Users

Think of data modeling as the architectural blueprint for your information. Before you build a complex Excel spreadsheet or a database, you need a plan. Data modeling is that plan—a visual map that shows how all your different pieces of data connect. It’s about creating order out of potential chaos, ensuring every bit of information has a clear place and purpose, especially within your workbooks.
What Is Data Modeling in Simple Terms?

Imagine trying to build a house without a blueprint. You’ve got all the materials—bricks, wood, windows—but no instructions on how they fit together. You'd end up with a mess. Data modeling is that crucial blueprint for your data, preventing you from building a wobbly, unreliable structure in Excel.
Spending too much time on Excel?
Elyx AI generates your formulas and automates your tasks in seconds.
Sign up →It’s the process of sketching out how different data elements relate. For instance, in an Excel workbook, a model would clearly show that a customer (on one sheet) can have multiple orders (on another sheet), and each order can contain several products (on a third sheet). This simple act of defining relationships turns raw, disconnected facts into a coherent, organized system that’s ready for real analysis with AI tools like PivotTables.
The Core Purpose of a Data Model
At its heart, data modeling is far more than just a technical task. It’s a strategic effort to bring clarity and consistency to your business information. The main goal is to build a solid framework that makes your data easy to understand, manage, and ultimately, use to make better decisions.
A well-designed model delivers some major wins:
- Improved Accuracy: By setting rules and defining relationships, it enforces data consistency and cuts down on frustrating errors in your spreadsheets.
- Greater Efficiency: When your data is structured for analysis in Excel's Power Pivot, building reports and dashboards becomes much faster.
- Clearer Communication: The model becomes a shared language, helping everyone from the sales team to the IT department get on the same page about what the data actually means.
Why Data Modeling Is More Important Than Ever
We're all swimming in more data than ever before. Trying to manage that volume in a massive, single-sheet Excel file without a solid plan is a recipe for disaster. That’s why modeling isn't just a "nice-to-have" anymore; it's a fundamental skill for anyone serious about data analysis.
Of course, before you can build a model, you need to know what you're working with. That’s where a process called data profiling comes into play. You can dive deeper into https://www.getelyxai.com/en/blog/what-is-data-profiling in our detailed guide. Visualizing these relationships is also key, and looking at essential tree diagram examples can give you great ideas for representing data hierarchies.
To get started, let's break down the fundamental building blocks of any data model.
Core Components of a Data Model at a Glance
This table provides a quick reference for the key pieces that make up a data model. Think of these as the basic vocabulary you'll need to organize your Excel data.
| Component | What It Is | Simple Analogy in Excel |
|---|---|---|
| Entity | A person, place, object, or concept you want to store data about. | A separate table or worksheet (e.g., "Customers"). |
| Attribute | A property or characteristic of an entity. | A column header (e.g., "Name" or "Price"). |
| Relationship | The connection or association between two or more entities. | A link between two tables using a common ID. |
| Constraint | A rule applied to the data to ensure accuracy and integrity. | A data validation rule in a cell. |
Understanding these four components is the first step toward building effective and reliable data models in Excel. With this foundation, you can start turning messy data into a powerful asset.
The Three Essential Types of Data Models
When you're building a data structure, you don't just jump straight into the technical details. Just like an architect creates different blueprints for a house—from a simple concept sketch to a detailed construction plan—data modeling follows a similar, phased approach.
We use three distinct types of models, each building on the last. It's a natural progression that takes an idea from a high-level business concept all the way to a concrete, technical implementation. This process ensures the final database or Excel model isn't just a technical marvel; it's also perfectly aligned with what the business actually needs.
The Conceptual Data Model: A High-Level Vision
First up is the Conceptual Data Model. Think of this as the back-of-the-napkin sketch. It’s the big-picture view you share with managers and stakeholders who don’t need to get bogged down in technical details. The goal here is simple: define the main business concepts (we call these entities) and show how they relate to each other.
For a retail company, a conceptual model might just show that a "Customer" places an "Order," and an "Order" contains a "Product." That's it. It’s all about the business logic, using plain language to get everyone nodding in agreement before any real technical work begins.
This model is all about scope and agreement. It's less about technology and more about creating a shared understanding of the business requirements among all stakeholders, from executives to project managers.
It answers one simple question: What information does our business care about?
The Logical Data Model: The Detailed Blueprint
Once everyone agrees on the high-level vision, it’s time to draft the Logical Data Model. This is the detailed architectural drawing. It takes the concepts from the first model and fleshes them out with a lot more structure, but it’s still technology-agnostic. That means you’re not deciding whether this will live in Excel, Oracle, or some other system just yet.
This is where you start defining the real nuts and bolts:
- Attributes: You’ll list out the specific properties for each entity. For instance, our "Customer" entity now gets attributes like CustomerID, FirstName, LastName, and Email.
- Primary and Foreign Keys: You'll define how everything connects. CustomerID becomes the unique identifier (the primary key) for the "Customer" table and a link (a foreign key) in the "Orders" table to connect an order back to a specific person.
- Relationships: The model clarifies the rules of these connections, like one-to-many (one customer can place many orders) or many-to-many.
Data architects and business analysts live in this space. It’s the critical bridge between what the business wants and how the tech team will build it.
The image below shows how moving through these stages helps a business succeed.
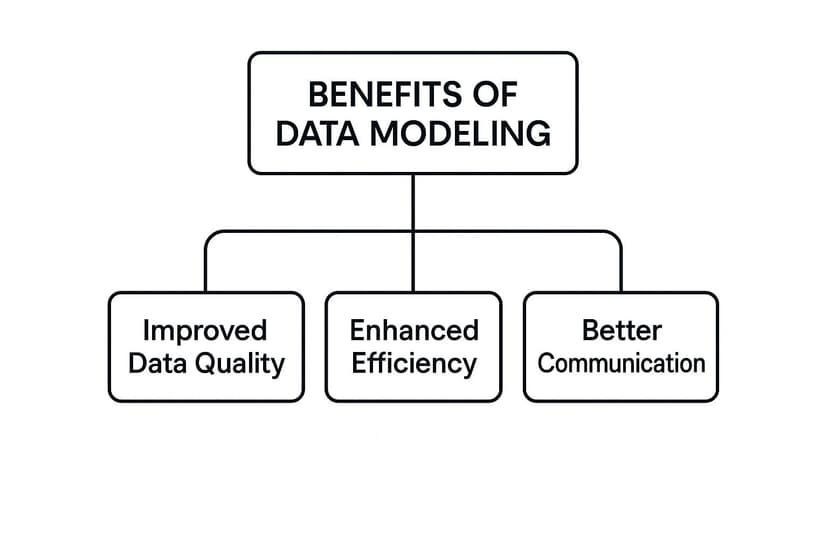
A well-structured model leads directly to better data quality, improved efficiency, and clearer communication across the board.
The Physical Data Model: The Construction Plan
Last, but certainly not least, is the Physical Data Model. This is the hands-on construction plan. It lays out exactly how the logical model will be built in a specific database system, whether that's MySQL or even the Data Model inside Excel's Power Pivot.
This is where the database administrators and developers take over. They translate the logical blueprint into a real, functioning database schema.
Here's what makes a physical model different:
- Table and Column Names: It specifies the exact, final names for tables and columns as they'll appear in the database.
- Data Types: Every column gets a precise data type, like
VARCHAR(50)for a name,INTfor an ID, orDATETIMEfor a timestamp. - Indexes and Constraints: It includes technical details like database indexes to speed up searches and constraints to ensure data integrity rules are followed.
If you’re an Excel user, the physical model is how you set up your tables in Power Query, define data types for each column (e.g., Number, Text, Date), and build the relationships in the Power Pivot window. It's the final, tangible step that brings your data structure to life.
Comparing Data Model Types: Conceptual vs. Logical vs. Physical
To make it easier to see how these three models differ, here’s a quick comparison. Each model serves a unique purpose and speaks to a different audience, moving from abstract ideas to concrete implementation.
| Attribute | Conceptual Model | Logical Model | Physical Model |
|---|---|---|---|
| Purpose | To define business concepts and rules. | To describe the data structure in detail. | To implement the database on a specific platform. |
| Audience | Business stakeholders, executives. | Business analysts, data architects. | Database administrators, developers. |
| Level of Detail | High-level, abstract. | Moderately detailed, structured. | Very detailed, technical. |
| Technology | Technology-independent. | Technology-independent. | Technology-specific (e.g., SQL Server, Excel). |
| Key Elements | Entities, relationships. | Attributes, primary/foreign keys. | Table names, column data types, indexes. |
By working through these three distinct phases, you create a data foundation that is solid, scalable, and perfectly aligned with its intended purpose—from both a business and a technical point of view.
Building Your First Data Model in Excel: A Step-by-Step Guide
Ready to get your hands dirty? Moving from theory to practice isn’t nearly as intimidating as it sounds, especially when you think about it in terms of the Excel work you already do. Let's walk through the core steps and turn those abstract ideas into concrete actions for your own spreadsheets.
Think of it like organizing a messy garage. Right now, your data is probably scattered everywhere. We’re going to build a system with dedicated shelves (tables) and clear labels (attributes) so you can find exactly what you need, right when you need it.

Step 1: Identify Your Core Entities
First things first, you need to pinpoint your entities. These are simply the main subjects or "nouns" your data revolves around. In the world of Excel, these will become your individual tables, each on its own worksheet.
Just look at your data and ask, "What are the main things I'm tracking here?" You'll quickly spot common examples like:
- Customers: The people or companies buying from you.
- Products: The actual items or services you're selling.
- Employees: The team members making it all happen.
- Sales: The records of each individual transaction.
Each of these is a core concept that deserves its own clean, dedicated table. The goal is to stop cramming everything into one giant, unmanageable spreadsheet—that's the very problem we're trying to fix.
Step 2: Define Attributes for Each Entity
Once you know your entities, it's time to define their attributes. These are just the specific details or characteristics of each entity. For Excel users, this is simple: attributes are your column headers.
Go through each entity (worksheet) and list the details you need to track in columns.
- For the 'Employees' table, your attributes might be EmployeeID, FirstName, LastName, Department, and StartDate.
- For the 'Products' table, you’d probably have ProductID, ProductName, Category, and Price.
The key is that each attribute should describe just one piece of information about the entity. This discipline is the foundation of a solid model, making sure every column has a clear, singular purpose.
This approach keeps you from mixing unrelated data, like sticking a customer’s home address in the middle of a sales transaction table.
Step 3: Establish Relationships Between Entities
Now for the magic: connecting the dots. Relationships are what show how your different tables interact with each other. This is where a data model truly comes alive, allowing you to build powerful PivotTables that pull data from multiple sources without a single VLOOKUP.
You create these connections using unique identifiers, often called keys. For instance, you can take the EmployeeID from your 'Employees' table and add it as a column in your 'Sales' table. In Excel's Power Pivot, you can then draw a line between these two columns.
This creates a clear link: one employee can be tied to many sales. That’s a one-to-many relationship, and it's one of the most common and powerful types you'll use in Excel.
Step 4: Normalize Your Data to Reduce Repetition
Finally, let's talk about normalization. It sounds technical, but the idea is simple: organize your tables to get rid of repetition. Redundant data doesn't just waste space; it’s a breeding ground for mistakes.
Imagine an Excel sheet where you have to re-type an employee's name and department for every single sale they make. If that employee moves to a new department, you'd have to hunt down and update every single entry. It's tedious and a recipe for error.
Normalization fixes this by breaking that messy, all-in-one table into lean, connected ones.
- First, you create a separate 'Employees' table where each employee is listed only once.
- Next, you have a 'Sales' table that contains only transaction data.
- Finally, you link them using the unique EmployeeID in Power Pivot.
Now, if an employee’s details change, you only have to update it in one place. This simple process makes your data more efficient, reliable, and a whole lot easier to manage. For a deeper dive into cleaning and transforming your data in Excel, check out our comprehensive Excel Power Query tutorial—it's the perfect tool for exactly these kinds of tasks.
Why Good Data Modeling Matters for Your Business
So, we've covered the "how" of building a data model in Excel. But why should you actually care? Why invest the time and effort? The answer is simple: a good data model is the bedrock of trustworthy insights and smarter, faster decisions.
Think of it this way. Without a model, your Excel workbook is like a library where all the books have been dumped in a giant pile on the floor. You might find what you're looking for, but it’s going to be a painful, slow, and messy process. A well-designed model is the librarian who organizes everything, putting each book on the right shelf, ready for you to find in an instant.
That kind of organization turns your raw data from a chaotic mess into a genuine strategic asset.
It Builds Unshakeable Trust in Your Data
The single biggest win from good data modeling is creating a single source of truth. When your data is consistent, clearly defined, and reliable, you can finally trust the numbers you see in your reports. This puts an end to those frustrating meetings where different departments show up with conflicting figures from their own spreadsheets, sparking debates about whose numbers are "right."
With a solid model in place, a metric like "monthly revenue" or "customer lifetime value" means the same thing and is calculated the same way for everyone. That consistency builds confidence and lets your teams focus on what the data is telling them, not whether the data itself is correct.
A well-structured data model acts as a pact of agreement across your organization. It ensures everyone is speaking the same data language, which is the first step toward making truly data-driven decisions.
It Bridges the Gap Between Teams
A clear data model acts as a common language, connecting the dots between your technical folks and your business teams. Imagine a marketing manager looking at a simple diagram that shows how "Campaigns," "Leads," and "Sales" are all linked. Suddenly, they can have a much more meaningful conversation with a data analyst.
This shared understanding is everything. It makes sure that the database or Excel report the tech team builds actually reflects the real-world business processes it’s supposed to. The model becomes a blueprint for collaboration, preventing costly misinterpretations down the road. Realizing the fundamental role data plays is key here. For more on this, exploring data's strategic importance for organizations can offer some great perspective.
It Saves Time, Money, and Headaches
Putting in the work to model your data upfront will save you an incredible amount of grief later on. When you catch structural problems and inconsistencies early, you stop them from snowballing into massive issues that require expensive, time-consuming fixes. The payoff comes in very real operational wins:
- Faster Analysis: In tools like Excel's Power Pivot, a clean model means PivotTables and reports refresh in seconds, not minutes. You get to skip the performance bottlenecks that plague poorly organized data.
- Reduced Errors: By setting the rules and relationships from the get-go, you dramatically cut down on data entry mistakes and inconsistencies, which leads to higher-quality data across the board.
- Easier Maintenance: When your data structure is logical and well-documented, making updates or adding new information is far simpler and less likely to break your existing reports.
At the end of the day, a good data model isn't just a technical diagram. It's a business practice that drives clarity, efficiency, and better decision-making.
Using AI to Simplify Data Modeling in Excel

Let’s be honest: building a proper data model in Excel has always been a bit of a grind. It’s a manual, sometimes painful process that demands a solid grasp of relationships, keys, and normalization—skills that don't come overnight.
But today, artificial intelligence is completely changing the game.
AI-powered Excel add-ins like Elyx.AI work like an intelligent assistant, taking over the heavy lifting. Instead of you manually piecing everything together in Power Pivot, these tools can scan your messy data, figure out the structure, and start building the model for you. This saves a massive amount of time and cuts down on those all-too-common human errors.
This isn’t just a small step forward; it's a practical solution for a real-world Excel problem. Data modeling has been around since the 1960s, but AI is finally making its most powerful concepts accessible to everyone, right inside their spreadsheets.
How AI Figures Out Your Data's Structure
One of the most useful things AI does is automatically spot the key pieces of your data (entities) and how they connect (relationships). Imagine you have an Excel workbook with separate tabs for sales, customers, and products.
An AI tool can look at all that raw data and make sense of it.
- It sees the 'Sales' sheet is where the main action happens.
- It recognizes 'Customers' and 'Products' are separate, important things.
- Then, it cleverly finds common links, like a 'CustomerID' column in both the sales and customer tabs, and instantly suggests connecting them.
This turns a manual puzzle into a guided experience. The AI connects the dots, shows you a proposed model, and lets you take it from there, solving a concrete problem that used to take hours of tedious work.
A Practical Example with Elyx.AI
Let's see this in action. Say your sales data is a mess, spread across different tabs. You need a clean, organized data model to start your analysis. With an AI assistant, the whole process becomes incredibly straightforward.
You can just tell the tool what you want in plain English, like: "Create a data model from the 'Sales', 'Customers', and 'Products' tabs, linking them by Customer ID and Product ID." The AI immediately gets to work, performing all the necessary steps behind the scenes.
The image above shows exactly how this works. A user types a complex request, and the AI breaks it down into a clear, step-by-step solution. It transforms a daunting task into something anyone can manage.
This is a huge benefit because it opens up proper data modeling to any Excel user, no advanced degree required. You can stop worrying about the tedious mechanics and focus on what the data is actually telling you. To see more ways these tools are changing the spreadsheet game, check out our guide on AI for Excel.
AI doesn't just make data modeling faster; it helps you build more accurate and sophisticated models than you might have on your own. It’s like having an expert looking over your shoulder, guiding you toward the best practices.
By bringing AI directly into the familiar Excel environment, tools like Elyx.AI make it possible for anyone to dig deeper into their data. You can now build the kind of powerful models that used to be reserved for data specialists—all without ever leaving your spreadsheet.
A Few Common Questions About Data Modeling
As you start data modeling in Excel, you're bound to have some questions. It’s a powerful discipline, but it definitely comes with its own language and concepts. To help you feel more confident and clarify what you've learned, here are answers to some of the most common questions people ask.
Think of this as your quick-start FAQ. It’s here to tackle those "wait, what's the difference?" or "how do I actually do this in Excel?" moments so you can get back to building something great with your data.
What’s the Difference Between a Data Model and a Database?
This is a common point of confusion, but the distinction is simple: a data model is the blueprint, and the database is the house you build from it.
-
A data model is the plan. It's a diagram or a set of rules you create before you have any data. It defines what information you’re going to store and how the different pieces relate to one another.
-
A database is the real, physical container where your data actually lives. It's the tangible result of your plan, with tables, columns, and rows of information.
In Excel, when you use Power Pivot to link your tables and set up relationships, you're building the data model. The collection of those tables, filled with your actual data, acts as your database.
Can I Really Do Data Modeling in Excel?
You absolutely can. While specialized database software is built for heavy-duty work, Excel has become a surprisingly powerful tool for data modeling, thanks to an add-in called Power Pivot.
Power Pivot lets you build a real data model by connecting multiple tables without ever touching a messy VLOOKUP again. You can create relationships between tables, add custom calculations with the DAX language, and work with millions of rows of data—far more than a standard worksheet could ever handle. It essentially turns your workbook into a lightweight relational database.
For many business users, Excel's Power Pivot hits the sweet spot. It gives you the horsepower of a database within the familiar, comfortable environment of a spreadsheet.
How Is Data Modeling Different from Data Analysis?
Data modeling and data analysis are two sides of the same coin. They work together, but they do very different jobs.
Data modeling is all about structure. Its main purpose is to organize your raw data into a clean, logical, and efficient framework. The final product is a well-built foundation that keeps your data reliable and makes the next step—analysis—possible.
Data analysis is all about insight. This is where you explore and interpret that nicely structured data to find trends, answer questions, and make decisions using tools like PivotTables and charts. You perform analysis on the data that your model has organized.
Put simply: you model the data first so you can analyze it effectively later. A great model makes for faster, easier, and more accurate analysis.
What Are the Most Common Mistakes to Avoid in Excel?
When you’re just starting, it’s easy to fall into a few common traps. Just knowing what they are can save you a world of frustration.
Here are a few key mistakes to watch out for:
- Not Understanding the Business Need: The single biggest mistake is building a model that doesn’t answer the right questions. Always start by asking what business problem you're trying to solve.
- Bad Naming Conventions: Using vague names like "Data1" for a table or "ColumnA" for a key field makes your model a nightmare for anyone else to use (including you, six months from now). Be clear, consistent, and descriptive.
- Forgetting to Plan for Growth: Designing a model that only works for your current, small dataset is a recipe for disaster. Think ahead. How might this data grow? Build your model to handle more volume down the line.
- Using VLOOKUP Instead of Relationships: The old way of pulling data together with VLOOKUP is slow and error-prone with large datasets. Learn to use Power Pivot to create relationships; it's the modern, correct way to model data in Excel.
Steering clear of these pitfalls will help you build models that aren't just technically correct, but are genuinely useful.
Ready to stop wrestling with manual data modeling and let AI do the heavy lifting in Excel? Elyx.AI is an intelligent Excel add-in that can automatically analyze your data, suggest relationships, and help you build a robust model in a fraction of the time. Transform your spreadsheets into powerful analytical tools today and leave with a new skill.
Learn more and get started at https://getelyxai.com.
Reading Excel tutorials to save time?
What if an AI did the work for you?
Describe what you need, Elyx executes it in Excel.
Sign up