Your First Excel Power Query Tutorial

If you've ever spent hours manually cleaning up messy spreadsheets, you know the soul-crushing routine. This Excel Power Query tutorial is your way out. Think of Power Query less like a feature and more like your personal data assistant—one you train once to handle all the tedious cleanup, forever.
Getting Started Without Getting Overwhelmed

Let's be real: wrestling with data in Excel is often a chaotic mess. You're stuck in a cycle of deleting rows, splitting columns, fixing text formats, and praying your VLOOKUPs don't break when a column gets moved. For many, this is just the "cost of doing business" in Excel.
Spending too much time on Excel?
Elyx AI generates your formulas and automates your tasks in seconds.
Sign up →But what if you could build an automated workflow that does all that for you with a single click? That's exactly what Power Query delivers. It’s not just another complex function to memorize; it's a powerful engine built right into Excel, designed specifically to automate the data grunt work you'd rather avoid.
The ETL Process, Demystified
Power Query brings a core concept from the big data world—Extract, Transform, Load (ETL)—right into your familiar Excel environment. It sounds technical, but the idea is straightforward:
- Extract: First, you connect to your data source. This could be anything from another Excel workbook or a CSV file to an entire folder of reports or even a web page.
- Transform: Here’s where the magic happens. You use a simple, visual interface to clean and shape your data. Every action, like removing duplicates or merging tables, is recorded as a repeatable step.
- Load: Finally, you send the clean, perfected data back into Excel, either as a new table on a worksheet or directly into a PivotTable for immediate analysis.
The real game-changer is that this process is repeatable. After you set up your steps, they're saved as a "query." Next month, when you get a new data file, you just hit "Refresh." Power Query runs through all your saved steps automatically. No more starting from scratch.
The goal here is to stop the endless cycle of copy-pasting and fragile formulas. Power Query lets you build a clean, reliable, and refreshable dataset—a true "single source of truth" for all your reports and dashboards.
A Quick Look: Power Query vs. The Old Way
To see just how much of a leap forward this is, let's compare the Power Query approach to the traditional, manual methods most of us are used to.
Power Query vs Traditional Excel Methods
| Feature | Manual Method | Power Query Method |
|---|---|---|
| Data Updates | Manually repeat all cleaning steps for new data. Highly error-prone and time-consuming. | Click "Refresh." The entire transformation sequence runs automatically in seconds. |
| Combining Data | Complex VLOOKUP, INDEX/MATCH, or manual copy-pasting from multiple files. | Use intuitive "Merge" or "Append" operations to combine tables from various sources. |
| Error Handling | Errors like #N/A or #VALUE! must be fixed individually with formulas (e.g., IFERROR). |
Built-in tools to replace errors, filter out problematic rows, or change data types easily. |
| Audit Trail | No record of what was changed. It's impossible to trace back how the final data was created. | Every transformation is listed as an "Applied Step," creating a clear, auditable trail. |
| Performance | Formulas on large datasets can slow Excel to a crawl and bloat file sizes. | Processes data efficiently in the background, keeping the main Excel file lean and responsive. |
As you can see, Power Query isn't just a minor improvement; it's a fundamental shift in how you can handle data within Excel.
Why This Is a Must-Know Skill Today
Microsoft actually introduced Power Query as an add-in way back in 2013, but for years it remained one of Excel's best-kept secrets. It's now a fully integrated, native part of Excel. Yet, even in training sessions as recent as 2019, it was common to find that only about 5% of attendees had ever heard of it.
Today, proficiency in Power Query gives you a massive professional edge. It changes your entire approach to data challenges, saving you hundreds of hours and dramatically cutting down on manual errors. This guide is designed to help you build a practical data analytics strategy for SMBs and finally make your data work for you, not against you.
Connecting to Your First Data Source

Alright, with the basic concepts under our belt, it's time to get our hands dirty. The first real step in any Power Query workflow is pointing it to your data. This is where the magic begins, and you'll quickly see just how flexible this tool is.
You'll start this journey on the Data tab in Excel's ribbon. Look for the "Get & Transform Data" section—your new best friend. Here, the Get Data button is your gateway. Clicking it reveals a dropdown menu packed with connectors for everything from simple files to complex databases. Honestly, for most of us, the go-to sources will be other workbooks, text files, or entire folders.
Importing From an Excel Workbook
Let's walk through a classic scenario: pulling data from a master sales report that lives in a separate Excel file. We've all been there, fighting with fragile links or spending way too much time copy-pasting. Power Query replaces all that with a solid, refreshable connection.
To get started, you'll navigate through Data > Get Data > From File > From Excel Workbook. This pops up a standard file browser. Once you've picked your source file, Power Query brings up the Navigator window. Think of this as your first checkpoint; it neatly lists out all the worksheets and, more importantly, any named tables within that workbook.
Here’s a pro tip that will save you countless headaches: always connect to a formatted Excel Table, not just a worksheet. Why? Because Tables have a defined structure. This makes your query far more resilient. If someone adds random notes or new columns outside the table's range, your query won't care. It just works. Select the table, and you'll see a preview on the right. Now, click Transform Data.
This single click launches the Power Query Editor. This is a completely separate window from your Excel spreadsheet, and it's the command center for all your data shaping. It's designed to handle millions of rows without making Excel crash and burn.
Tapping into CSV Files and Folders
Connecting to a CSV (Comma-Separated Values) file is just as simple. You follow a similar path: Data > Get Data > From File > From Text/CSV. Power Query is usually smart enough to figure out the delimiter (like a comma) on its own and show you a clean preview.
But here’s where things get really interesting. What if you have a folder full of monthly sales reports, each one a separate CSV file? Instead of painstakingly connecting to each one, you can connect to the entire folder at once. This is one of Power Query's most powerful features.
- Choose Data > Get Data > From File > From Folder.
- Just browse to and select the folder holding your reports.
- Power Query will show you a list of the files inside. From here, click Combine & Transform Data.
A dialog box will appear, asking you how to combine the files (it usually uses the first file as a template). Power Query then automatically builds the steps to merge every file into one clean, master table. The best part? When next month's report gets dropped into that folder, all you have to do is hit "Refresh," and it’s instantly added to your master dataset. It's a game-changer.
A First Look at the Power Query Editor
Once you’ve loaded your data, you’ll find yourself in the Power Query Editor. It can seem a bit much at first, but it's organized logically.
- The Ribbon: Just like in Excel, this is where you'll find all your transformation tools, neatly organized in tabs.
- Queries Pane: On the left, you'll see a list of all your active data connections.
- Data Preview: The main event—a grid showing a preview of your data.
- Query Settings: This pane on the right is critical. Here, you can rename your query and see the list of Applied Steps, which is a recorded history of every single transformation you make.
Since it first appeared, Power Query has been a major force behind the rise of self-service business intelligence. When it debuted in 2013, it was downloaded hundreds of thousands of times in its first year as people discovered they could finally merge data from databases, CSVs, and web pages without calling the IT department. As you start out, a key concept is learning how to automate data extraction from these different sources.
Essential Data Transformation Techniques
Once your data is pulled into the Power Query Editor, you’ve arrived at the workshop. This is where the real magic happens, turning that messy, inconsistent data into a clean, analysis-ready asset. I'm going to walk you through the most common and powerful transformations you'll find yourself using every day.
We've all been there—staring at a spreadsheet with jumbled date formats, names crammed into a single column, or hidden extra spaces messing up our VLOOKUPs. Power Query tackles these headaches not with complicated formulas, but with a series of simple, repeatable clicks.
Take a look at the editor in the screenshot above. It's your command center. The grid in the middle shows a preview of your data, the ribbon up top holds all your tools, and that "Applied Steps" pane on the right is your secret weapon—it records every single move you make. As you clean the data, each click adds a step to that list, building a process you can run again with a single refresh.
Cleaning and Shaping Your Columns
The first order of business is usually getting your columns right. You’ll almost always have columns you don’t need, or data types that Excel guessed wrong. Nailing these fundamentals first makes everything else downstream so much easier.
A great place to start is by getting rid of irrelevant information. Let's say your sales export includes columns like "Internal Tracking ID" or "Last Modified By." For your analysis, that's just noise. In Power Query, you can simply select them and hit Remove Columns.
Here's a pro-tip from experience: instead of removing the columns you don't want, select the columns you do want to keep and then choose Remove Other Columns. This makes your query far more resilient. Why? Because if someone adds a few more useless columns to the source file next month, your query will automatically ignore them on refresh. It only knows to keep the good stuff.
Common Column-Level Transformations
You'll find yourself relying on a handful of column transformations constantly. These are the workhorses:
- Change Data Type: Is your "Sales" column showing up as text? Just select the column, click the little "ABC" icon in the header, and switch it to Currency or Decimal Number. This is absolutely critical for doing any math.
- Split Column: A true lifesaver. Got a "Full Name" column? You can instantly break it into "First" and "Last" name columns. Just select the column, use the Split Column tool, and tell it to split by the space. Done.
- Merge Columns: This is just the reverse. You can take a "City" column and a "State" column and combine them into a single "Location" column. Power Query even lets you add a custom separator, like a comma and a space, between the values.
Power Query's ability to record these changes as "Applied Steps" is what sets it apart. You aren't just cleaning data one time; you're building an automated cleaning machine. Each step is a permanent, repeatable part of your workflow.
These data transformation features are a huge reason why Power Query is so valuable in finance and analytics. The built-in tools let you profile your data, giving you a quick visual summary of column stats so you can spot duplicates, errors, and other quality issues right away. This radically speeds up the entire data preparation process, which is a lifesaver when you're dealing with massive datasets where manual cleaning would be a nightmare.
Handling Rows and Filtering Data
With your columns looking sharp, the next move is to filter your rows. You want to make sure you're only working with the data that matters for your specific analysis. This feels a lot like using filters in standard Excel, but it's way more powerful because the filter criteria are saved and reapplied automatically every time you refresh.
Imagine you have a sales report covering all regions, but you only need to analyze the "North" region. Just click the filter arrow on the "Region" column header, uncheck "Select All," and then tick the box for "North." That action gets recorded as an Applied Step and becomes a permanent part of your query.
Beyond simple filtering, you can do some other powerful row-level cleanup:
- Remove Duplicates: A single click can scan your entire dataset and eliminate any rows that are perfect duplicates. It’s an instant data-cleansing win.
- Remove Blank Rows: Data exports are often full of empty rows. The Remove Blank Rows feature gets rid of them in a flash.
- Filter out Errors: If your data has error values like
#N/Aor#DIV/0!, you can use the column filter to remove them so they don't break your calculations later on.
These tools do more than just clean up; they prepare your data for serious analysis. For instance, getting your data pristine is the first step toward mastering margin calculations in Excel. The cleaner and more reliable your source data is, the more you can trust your final numbers.
There are plenty of other advanced options to explore. For a deeper look, check out our complete guide on data transformation in Excel. By mastering these core techniques, you’ll build the confidence to tackle any messy dataset that comes your way.
Putting It All Together: Merging and Appending Queries
Let’s be honest: your data is never waiting for you in one tidy file. In the real world, it's spread out across different tables, spreadsheets, and reports. This is where Power Query truly shines, giving us two powerful ways to bring it all together: appending and merging.
Getting a handle on these two operations is a game-changer. They sound similar, but they solve completely different problems. Think of it like this: appending stacks your data vertically, while merging joins it horizontally. Using them correctly is how you build a single, reliable dataset for your analysis.
The chart below shows how much time is typically spent on different parts of a Power Query project. As you can see, a huge chunk of time goes into cleaning and prepping the data.
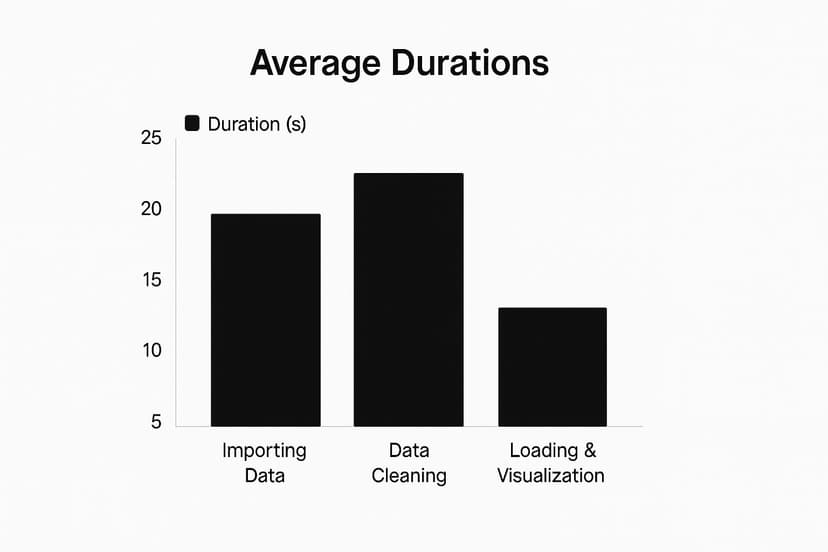
While data cleaning takes the lion's share of the effort, merging and appending are the foundational steps that let you apply those cleaning rules across multiple sources at once.
Appending Queries to Stack Your Data
Appending is the more straightforward of the two. It’s all about stacking tables that have the same, or at least very similar, column structures.
Imagine you get separate sales reports every quarter—Q1 Sales, Q2 Sales, Q3 Sales, and Q4 Sales. Each spreadsheet has the exact same columns: "Date," "ProductID," "Region," and "SalesAmount." Instead of manually copying and pasting, you'd append them. Power Query will take all the rows from Q2 and add them to the bottom of Q1, then add Q3, and so on. The result is one long, continuous table holding a full year's worth of data.
You can find this feature on the Home tab in the Power Query Editor under Append Queries. It’s incredibly efficient for consolidating data that’s been split up over time (like monthly reports) or by category (like regional sales figures).
Merging Queries to Join and Enrich Your Data
Merging is a different beast altogether. This is how you join tables side-by-side based on a common column. If you’ve spent hours wrestling with VLOOKUP or INDEX/MATCH in Excel, you'll feel right at home here—except a merge in Power Query is infinitely more powerful and less prone to errors.
Let’s say you have a "Sales" table with your transaction data, including a "ProductID." You also have a separate "Products" table that lists all the product details—"ProductName," "Category," "Supplier"—also linked by "ProductID." A merge lets you pull those product details over and add them as new columns to your main "Sales" table.
The beauty of this is that it happens before the data ever hits your Excel sheet. You create the join once in the query, and what you load is a clean, enriched table ready for analysis. No more fragile formulas that break when someone adds a column.
By merging queries, you're not just looking up a value; you're fundamentally enriching your core dataset. This creates a more robust and context-rich table that can power more insightful PivotTables and charts without wrestling with complex formulas in Excel.
Understanding Power Query Join Types
When you set up a merge, Power Query will ask you to pick a Join Kind. This tells it exactly how to handle the rows from your two tables, especially when a match isn't found. This is a critical choice that directly impacts your final dataset.
Here's a quick reference table to help you understand the most common join types and when you might use them.
| Join Type | What It Does | Common Use Case |
|---|---|---|
| Left Outer | Keeps all rows from the first (left) table and brings in matching data from the second (right) table. | Your go-to for enriching a primary table. Think: adding product details to your main sales table. |
| Inner | Only keeps rows that have a match in both tables. Anything without a match is discarded. | Finding the intersection between two lists, like seeing which customers have made a purchase this year. |
| Full Outer | Keeps all rows from both tables, matching them where possible and showing null where there's no match. | Creating a complete master list from two separate sources when you can't afford to lose any data. |
Choosing the right join is essential. A Left Outer is perfect for adding more context to a primary dataset, while an Inner join is great for finding what two lists have in common. Once you master both appending and merging, you have complete control to shape and combine data from almost any source.
Workflow Tips and Best Practices
Knowing the basic transformation steps is one thing, but building a query that's robust, efficient, and easy to understand is a completely different ballgame. As you graduate from simple data cleaning to more involved projects, picking up a few key habits will save you—and your teammates—a world of headaches later on. It’s what separates a query that just works today from one that's a reliable asset for years to come.
The first habit to get into is meticulous organization. Start by giving your queries and transformation steps clear, descriptive names. Don't leave the defaults like "Source1" or "Changed Type2." Instead, rename each step to explain what it does, like "Renamed 'Sales Rep' to 'Account Manager'" or "Filtered Out Pre-2023 Data." This practice creates a self-documenting audit trail that makes your logic a breeze to follow, even months down the line.
And when you're juggling multiple queries, make friends with the grouping feature in the Power Query Editor. You can create folders like "Source Files," "Staging Tables," and "Final Output" to keep your query pane from becoming a chaotic mess. A tidy workflow is infinitely easier to troubleshoot and hand off to a colleague.
Future-Proofing Your Queries
A classic rookie mistake is building a query that’s too brittle. It works flawlessly with today's source file, but the whole thing shatters the moment a column gets added or renamed. One of the best ways to build more resilient queries is to be smart about how you manage columns.
Here's a prime example: let's say you have 15 columns and only need 10. Instead of selecting the five columns you don't want and hitting Remove Columns, it's almost always better to select the ten columns you do need and choose Remove Other Columns.
This simple switch makes your query far more durable. If the source file gets an update next month with three new, irrelevant columns, your query won't break. It will just ignore them because you only told it which columns to keep.
Think of your query not as a static set of instructions, but as a flexible recipe that can adapt to minor changes in the ingredients. Your goal is to build a process that anticipates future variations in the source data, minimizing the need for manual fixes.
Working with M Code and the Advanced Editor
While you can get about 95% of your work done through the graphical interface, there are times when you need to pop the hood. Every single click you make in the Power Query Editor generates code in a language called M. You can see and edit this code directly by opening the Advanced Editor.
You don't need to become an M code wizard overnight, but understanding how to make small edits can be a real superpower. For instance, you might want to switch a hard-coded file path to a dynamic one or add comments to explain a particularly tricky transformation. Getting comfortable with the Advanced Editor is the key to solving problems that the standard user interface can't handle on its own.
These practices are the foundation for creating truly effective data workflows. For those looking to push their efficiency even further, you might also find our guide on how to automate Excel helpful, as it builds on many of these core concepts. By focusing on creating robust and maintainable queries from the start, you’re building assets that save time and eliminate errors for the long haul.
Your Top Power Query Questions Answered
When you first start digging into Power Query, it's natural to run into questions. It’s a completely new way of thinking about data in Excel, and it’s normal to wonder how it fits with the tools you already know, like macros. I've heard these questions time and again from people making the switch.
Let's clear up some of the most common points of confusion. These aren't just hypotheticals; they're the real-world hurdles people face when moving from manual data wrangling to a more automated Power Query workflow.
How Is Power Query Different From a Standard Excel Macro?
This is easily the most frequent question, and for good reason. Both Power Query and VBA macros help you automate work in Excel, but they do it in fundamentally different ways. The best way I can explain it is this: a macro is like a robot that perfectly mimics your mouse clicks, while Power Query understands the logic behind your actions.
A macro records a sequence of physical steps: "click cell B2," "copy," "move to column F," "paste." This is fantastic for simple, repetitive tasks, but it's incredibly rigid. If someone adds a column to your source file or renames it, your macro will almost certainly break because the physical layout it was built for has changed.
Power Query, on the other hand, records the why behind your transformations. Instead of remembering clicks, it logs instructions like "Remove the 'Sales_ID' Column" or "Filter the 'Region' column to only show 'North'."
Power Query is a structured, adaptive process. When you refresh a query, it re-applies these logical steps to the source data, no matter how many rows have been added or if columns have been reordered (as long as their names are the same). A macro is a rigid script; Power Query is a flexible recipe.
Can I Use Power Query on a Mac?
Yes, you can! But—and this is a big but—the experience isn't quite the same as on Windows. Excel for Mac has Power Query, but its functionality is more limited.
Here's what Mac users can do without any issues:
- Refresh existing queries: If a coworker builds a query on a Windows PC and sends you the file, you can open it on your Mac, hit refresh, and the data will update. This is a lifesaver for teams using both operating systems.
- Create new queries from local files: You can connect to and pull data from local sources on your Mac, like other Excel workbooks or basic text and CSV files.
The limitations show up when you need more advanced connectors. The Mac version currently can't connect directly to many databases, web sources, or use the incredibly useful "From Folder" connector. The Power Query Editor itself is also a more streamlined version of what Windows users have. For full-blown query development, Windows is still the platform of choice.
What Happens If My Source Data Changes?
This scenario is exactly why Power Query is so brilliant. The entire tool is built around the idea of being refreshable and dynamic. Once you've set up your query and loaded your clean data into Excel, you never have to go through those cleaning steps again.
Let's say your source is a CSV file that gets exported from your sales system every Monday. When the new file replaces the old one, all you have to do is go to the Data tab in Excel and click Refresh All.
In an instant, Power Query will:
- Go back to the source file you pointed it to.
- Run through every single transformation step you created, in the exact same order.
- Load the freshly cleaned and updated data right into its destination table.
This turns recurring reporting tasks from a multi-hour manual chore into a single click. It's a game-changer for any kind of weekly or monthly reporting, especially in finance where speed and accuracy are everything. This kind of automation is key to achieving more reliable outcomes, a topic we cover in our guide on financial reporting automation.
Do I Need to Learn M Code to Use Power Query?
Not at all. For probably 95% of what you'll ever need to do, you won't touch a single line of M code. The Power Query Editor's point-and-click interface is so well-designed that you can build incredibly complex data transformations just by using the buttons in the ribbon.
Every time you click an option—like splitting a column or filtering rows—Power Query is busy writing the corresponding M code for you in the background. You can actually see it being generated in the Formula Bar or by opening the Advanced Editor.
Learning the M language is what unlocks that final 5% of power. It's for when you need to write your own custom functions or handle a truly bizarre data problem that the built-in tools can't solve. But it's absolutely not a prerequisite. My advice? Get comfortable with the interface first. You’ll be stunned by how much you can do without ever typing a single line of code.
Ready to take your Excel skills to the next level? Elyx.AI is an AI-powered add-in that brings the power of intelligent analysis directly into your spreadsheets. Generate insights, clean data, and even translate entire columns with simple, natural language prompts. Stop wrestling with complex formulas and start getting answers.
Discover how Elyx.AI can transform your workflow today!
Reading Excel tutorials to save time?
What if an AI did the work for you?
Describe what you need, Elyx executes it in Excel.
Sign up