How to Analyze Survey Data in Excel (5-Step Process)

So, you’ve just run a survey and now you’re staring at a spreadsheet filled with raw responses. It can feel a little overwhelming, with hundreds or even thousands of rows of ratings, open-ended comments, and demographic data. What’s the first move?
It’s tempting to jump straight into creating charts and running formulas, but the real key to a successful analysis in Excel starts with building a solid foundation. This guide will provide a practical, step-by-step process for turning that raw data into clear, actionable insights using the power of Excel and artificial intelligence.
Setting the Stage for Your Survey Analysis in Excel
Before you touch a single cell, you need to know what you're looking for. What questions are you actually trying to answer? Are you trying to figure out if customers are happy with a new product feature? Or maybe you're trying to pinpoint where users get stuck in your app. Without clear goals, you’ll just be swimming in numbers without any real direction.
Spending too much time on Excel?
Elyx AI generates your formulas and automates your tasks in seconds.
Sign up →Once you know your "why," the next step is getting your data into Excel and, crucially, cleaning it up. This is where a lot of people trip up. Raw data from survey tools like Google Forms or SurveyMonkey is almost never perfect. You'll find typos, inconsistent formatting, and blank cells that can throw off your entire analysis if you don't deal with them first.
Think of it this way:
- Set Clear Goals: What do you need to learn? For example, "I need to find our Net Promoter Score (NPS) and see what makes our long-term users happy."
- Import Your Data: Get all the responses into a fresh Excel worksheet.
- Clean Everything Up: This is a vital step. Fix typos, make sure text entries are consistent (like changing "USA" and "U.S." to "United States"), and figure out what to do with missing answers.
The infographic below nails this workflow, showing how these foundational steps set you up for a meaningful analysis.
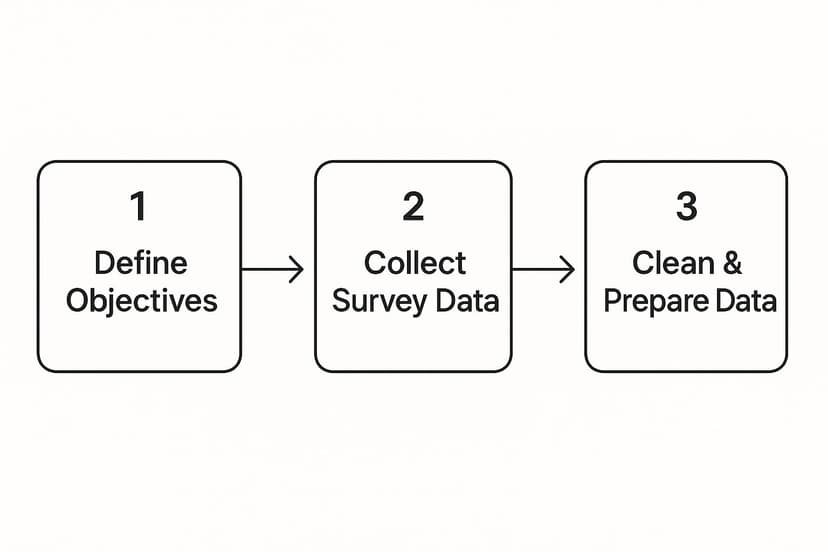
As you can see, preparation isn't just a preliminary task—it's half the battle.
Why a Clean Dataset Is Non-Negotiable
A clean dataset becomes your single source of truth. It guarantees that when you start building PivotTables or applying formulas, the results you get are based on reliable, accurate information. If you want to get into the nitty-gritty of this process, our guide on how to clean data in Excel is a great resource.
Taking the time to clean your data properly is what prevents a simple typo or inconsistent entry from leading you to a completely wrong conclusion. It’s the safety net that ensures your business decisions are based on solid ground.
To give you a sense of how critical this is, look at a massive operation like the Gallup World Poll. Since 2005, they've surveyed people in over 140 countries, covering more than 95% of the world's adult population. The only way they can produce reliable insights from that much data is through incredibly rigorous collection and cleaning standards. It’s a process that turns a world of opinions into clear, comparable data points.
Here's a quick reference table to keep these initial actions top of mind.
Foundational Actions for Survey Data Analysis
| Action | Why It's Important | Excel Tool/Function |
|---|---|---|
| Define Objectives | Provides focus and prevents you from getting lost in the data. | N/A – This is a strategic step before using Excel. |
| Import Data | Brings all raw responses into a single, workable environment. | Data Tab -> From Text/CSV or Get & Transform (Power Query) |
| Remove Duplicates | Prevents single respondents from being counted multiple times. | Data Tab -> Remove Duplicates |
| Standardize Text | Ensures consistency for accurate counting and filtering (e.g., "NY" vs "New York"). | FIND & REPLACE, TRIM(), PROPER() formulas. |
| Handle Blanks | Missing data can break formulas or skew averages if not addressed. | Filter for Blanks, then decide whether to delete rows or fill values. |
Taking care of these steps first will make the rest of your analysis in Excel much smoother and far more reliable.
Turning Raw Data into Actionable Insights
With your survey data cleaned up and ready to go, the real analysis can begin. This is where you start to turn individual responses into a clear story. The very first thing I always do is convert the raw data into an official Excel Table.
It's a simple keyboard shortcut: just click anywhere inside your data set and press Ctrl+T. This isn't just about formatting. This single action turns your static sheet into a dynamic database. Now, formulas will automatically fill down, filtering becomes easier, and any charts you build will instantly update as new survey responses are added. Trust me, it’s a non-negotiable step that makes everything else smoother.
Let PivotTables Do the Heavy Lifting
Now that you have a proper Excel Table, you're set up to use what I consider the most powerful tool for this kind of work: the PivotTable. PivotTables let you slice, dice, and summarize massive amounts of information in seconds, without writing a single complex formula.
To get started, click inside your table, head over to the Insert tab, and choose PivotTable. Excel will bring up a panel where you can drag and drop your survey questions into four distinct areas:
- Rows: Perfect for categories you want to group by, like "Department" or "Age Range."
- Columns: Use this to compare different groups, such as "Product Tier" or "Region."
- Values: This is for the numbers you want to calculate—counting responses, averaging satisfaction scores, etc.
- Filters: This lets you zoom in on a specific slice of your data, like only looking at responses from the last quarter.
The real beauty here is the interactivity. You can instantly see the average satisfaction score for each customer segment, then drag another field in to break it down by which product they use. If you're just getting started, our guide on creating PivotTables in Excel is a great resource.
Finding the Story with Cross-Tabulation
The true power of PivotTables comes alive when you use them for cross-tabulation. This is just a fancy term for comparing two or more survey questions to see how they relate to each other. For example, is there a link between a customer's age and how likely they are to recommend your service?
Cross-tabulation is where you stop asking "what" people think and start uncovering "why." It reveals whether specific groups—say, new customers versus veteran users—feel differently about your product.
This is what separates basic reporting from genuine analysis. By segmenting your data and comparing responses across different groups, you can spot patterns that would otherwise be completely hidden. You might find that your overall satisfaction score is a healthy 8/10, but a specific demographic is consistently rating you a 4/10. That's not just a statistic; that's a bright, flashing signal telling you exactly where to focus your improvement efforts.
Ultimately, organizing your data this way transforms your spreadsheet from a list of answers into an interactive dashboard where you can test ideas and find compelling stories buried in the numbers.
Digging Deeper with Formulas and AI
PivotTables are brilliant for getting a bird's-eye view of your survey data, but the real story is often tucked away in the details. To move past broad summaries, you have to start asking more targeted, conditional questions. This is where Excel formulas come into their own, letting you perform the kind of surgical analysis that PivotTables can't handle alone.
For instance, what if you want to find the average satisfaction score, but only for customers who mentioned "customer service" in their open-ended feedback? A PivotTable will struggle with that. A formula, however, can nail it. This is the next level of truly effective survey analysis.
Getting Specific with Conditional Formulas
Instead of getting tangled up in complex PivotTable filters, a few powerful functions can get you the precise answers you need. These formulas are designed to look at your data and only run a calculation when specific conditions are met, giving you a much sharper, more granular perspective.
Here are the three heavy hitters you’ll use most often:
- COUNTIF: This is your go-to for counting cells that meet a single criterion. You can instantly see how many people answered "Strongly Agree" to a question with a formula like
=COUNTIF(C2:C101, "Strongly Agree"). - SUMIF: Need to add up values that match a specific condition? This is the one. It's great for things like calculating the total revenue from customers in a particular city.
- AVERAGEIF: Perfect for finding the average of a set of numbers that belong to a specific category. A practical example is finding the average satisfaction score (column D) for a specific product (in column B):
=AVERAGEIF(B2:B101, "Product A", D2:D101).
With just a few keystrokes, these functions let you leap from general observations to specific, evidence-backed insights.
The real magic happens when you combine classic formulas with modern tools. This blend lets you test your hunches quickly and explore the nuances in your data without having to be a spreadsheet wizard.
Bringing in AI to Supercharge Your Analysis
Formulas are powerful, but let’s be honest—they can be a pain to write, especially when you're dealing with messy qualitative data. This is where an AI tool that lives right inside Excel, like Elyx.AI, completely changes the game. It’s the perfect bridge between manual formula-writing and automated insight.
With an AI assistant, you can skip the syntax and just ask a question in plain English. For example, a prompt like, "Summarize the main themes from the open-ended feedback in column G," can give you a clean, categorized summary in seconds. You can learn more about this approach in our guide to using AI for data analysis.
Combining traditional Excel functions with AI gives you a complete toolkit. For more complex scenarios, you can even explore regression modeling to see how multiple factors influence a key outcome. As statistical guides from the United Nations Statistics Division explain, different models like multiple linear or logistic regression are used depending on whether your data is continuous (like an age range) or binary (a simple yes/no). This advanced approach helps you isolate the impact of several different variables at once.
With tools like Elyx.AI, you can ask it to generate the right formulas for you, analyze sentiment, or even build entire PivotTables from a simple text prompt. It frees you up to focus on what actually matters: interpreting the results and making smart decisions.
Telling Your Data Story with Compelling Charts
You’ve done the heavy lifting. You've cleaned the data and used pivot tables and formulas to uncover powerful numbers. But a spreadsheet full of numbers rarely inspires action. The magic happens when you turn those numbers into a story people can understand at a glance. This is where Excel's charting tools really shine.

Effective data storytelling isn't about making the prettiest graph. It's about picking the right tool for the job. Your mission is to create a visual that instantly communicates a key finding without a lengthy explanation. A great chart is the difference between a report that gets read and one that gets ignored.
Choosing the Right Chart for Your Survey Data
Different types of survey questions need different visual treatments. It’s tempting to use a pie chart for everything, but that's a rookie mistake that can hide the real story. Every chart type tells a story differently, so matching your data to the right format is everything.
I find myself coming back to a few key charts that work wonders for survey results:
- Bar Charts: These are your go-to for comparing different groups. Need to show how satisfaction scores vary by customer segment? Or which product features got the highest ratings? A bar chart is perfect.
- Line Charts: Nothing beats a line chart for showing how things change over time. If you're tracking customer feedback quarterly or annually, this is the clearest way to show if things are getting better or worse.
- Stacked Column Charts: I love these for showing part-to-whole relationships. They’re great for visualizing the breakdown of responses (like Strongly Agree, Agree, Neutral) across several questions, all in one view.
When you pick the right visual, you're not just showing data; you're directing your audience's focus to the patterns that matter most.
Formatting Charts for Maximum Impact
Just because you’ve made a chart doesn’t mean you’re done. A cluttered visual can do more harm than good by burying the insight you worked so hard to find. The goal here is to strip away anything that doesn't help tell the story.
I always think of a chart like a single, powerful sentence. Every element—the title, the colors, the labels—is a word in that sentence. If it doesn't make the meaning clearer, it's just noise. Get rid of it.
Focus on these three simple rules to create clean, professional charts that get your point across fast:
- Write a Clear, Action-Oriented Title: Ditch generic titles like "Survey Results." Instead, tell the story upfront with something like, "Customer Satisfaction Drops 15% Among New Users." It immediately tells the reader what to look for.
- Use Color with a Purpose: Don't just accept Excel's default rainbow colors. Use a neutral palette (like shades of grey) for your data and one bright, contrasting color to highlight the most important finding. It’s like using a highlighter on your data.
- Declutter Ruthlessly: Get rid of unnecessary gridlines, borders, and any data labels that don't add crucial context. Simpler is almost always better. The cleaner the visual, the quicker the insight sinks in.
Making these small tweaks will transform a basic chart into a powerful piece of evidence, turning your analysis into a clear story that can actually drive decisions.
From Insights to Impact: Making Your Data Drive Decisions
You’ve wrangled the data and built some beautiful charts. That's a great start, but the analysis is only as good as the changes it creates. The real value comes when you turn those findings into a story that inspires action. This is the moment your hard work pays off, transforming a spreadsheet from a jumble of responses into a roadmap for better business decisions.
The goal isn't just to report what you found, but to explain what it means and what to do about it. Think back to the questions you started with. Did your analysis answer them? Your first task is to boil everything down to the most critical takeaways—the trends, connections, and surprising discoveries that really matter.
Weaving a Story From Your Data
A powerful report is more than a list of facts; it's a narrative. Your role is to be the storyteller, connecting the dots between different pieces of data to paint a clear picture.
For instance, don't just say, "75% of users find our new feature useful." That's a good start, but it's not the whole story. Dig deeper. You could connect it to another finding: "While three-quarters of our users love the new feature, we noticed adoption is 40% lower among customers who joined in the last three months. This points to a potential gap in our onboarding for new clients."
See the difference? You've just turned a static number into a business problem with a clear path toward a solution. You've moved from observation to interpretation.
The best reports I've ever seen don't just dump data on you. They guide you through the evidence, build a case, and lead you to a logical, data-backed conclusion about what needs to happen next. They have a clear point of view.
A Simple Framework for Actionable Recommendations
If you want your insights to actually lead to change, you need to present them in a way that's impossible to ignore. Every single recommendation you make should be tied directly back to a specific finding from your survey.
Here’s a simple but effective framework I always use:
- The Finding: State what you discovered, plain and simple. (e.g., "Customer satisfaction is 20% lower for users who've had to contact our support team.")
- The Implication: Explain why this matters to the business. What's the "so what?" (e.g., "This shows a major friction point in our customer service journey, and it's likely hurting our retention rates.")
- The Recommendation: Propose a concrete, measurable next step. (e.g., "I recommend we develop and roll out a new training module for the support team, focused on first-contact resolution.")
When you structure your conclusions this way, you make it incredibly easy for stakeholders to grasp the problem, understand its impact, and get on board with your proposed solution. This final step is what ensures your analysis doesn't just get filed away, but actually becomes a catalyst for real, meaningful change.
Got Questions About Analyzing Surveys in Excel? We’ve Got Answers
Once you start digging into your survey data, a few common questions always seem to come up. It's totally normal to hit a snag, especially when the data isn't perfectly clean. Let's walk through some of the most frequent challenges people face when trying to analyze survey data in Excel.

What’s the Best Way to Handle Open-Ended Text Responses?
Open-ended comments are a goldmine of genuine feedback but can feel overwhelming to sort through. A practical approach is to start by reading a sample of the responses manually. This gives you a gut feeling for the common themes and keywords people are using.
Once you have an idea of the topics, you can add new columns to categorize each comment. Think buckets like 'Pricing,' 'Customer Service,' or 'Product Feature.' From there, Excel's Filter and Search tools are your best friend for grouping similar comments together for this manual coding process.
Of course, if you're dealing with hundreds or thousands of comments, this is where a tool like Elyx.AI becomes a lifesaver. It can automatically run sentiment analysis on each comment or classify them into key themes, turning a multi-hour job into something you can finish in minutes.
How Should I Analyze Likert Scale Data?
Likert scale questions—the classic "Strongly Disagree" to "Strongly Agree" format—are everywhere. The absolute first thing you need to do is convert those text responses into numbers. A simple way to do this in Excel is with a nested IF formula or by using Find and Replace.
A typical five-point scale usually looks like this:
- Strongly Disagree = 1
- Disagree = 2
- Neutral = 3
- Agree = 4
- Strongly Agree = 5
Once your data is numerical, you can instantly calculate the mean (the average score) using the AVERAGE function and standard deviation with STDEV.S for each question. This gives you a quick read on the central opinion and how varied the responses are. For visuals, a diverging stacked bar chart is fantastic here; it paints a clear picture of the positive, neutral, and negative sentiment all at once.
What Should I Do About Missing Data?
Missing data is a fact of life in survey analysis. The first step is to figure out if the gaps are large enough to skew your findings. If you have a huge dataset and only a few responses are missing, it probably won’t be a major issue.
You have a couple of options in Excel. The easiest is to simply filter out rows that have blanks for the specific question you're analyzing at that moment. For numerical data, some people replace blanks with the column's mean or median, but be careful with that approach—it can definitely influence your results.
My best advice is to always be upfront about missing data. When you present your findings, make a note of how many people didn't answer key questions. It keeps your analysis honest and shows you’ve considered its limitations.
Can I Actually Determine Statistical Significance in Excel?
Absolutely. While it's not a powerhouse statistical package like SPSS, Excel is surprisingly capable of running basic significance tests. The secret is to enable the free Analysis ToolPak add-in, which unlocks a bunch of more advanced functions.
Once you have it enabled (go to File > Options > Add-ins), you can run t-tests to compare the averages of two different groups or an ANOVA to compare three or more. For example, you could use a t-test to see if the difference in satisfaction scores between your US and European customers is a real, meaningful difference or just random noise. For most business use cases, Excel has more than enough power to get you started.
Ready to stop wrestling with formulas and start getting instant insights from your survey data? Elyx.AI brings the power of artificial intelligence directly into your spreadsheet, letting you clean data, generate charts, and summarize feedback with simple, natural language. Take the manual work out of your analysis and discover the stories hidden in your data. Explore what you can do with Elyx.AI today.
Reading Excel tutorials to save time?
What if an AI did the work for you?
Describe what you need, Elyx executes it in Excel.
Sign up