Customer Segmentation Analysis in Excel Made Easy

Customer segmentation analysis is all about taking your massive customer list and breaking it down into smaller, more focused groups based on what they have in common. Think of it as switching from a megaphone, shouting the same message to everyone, to having a series of meaningful conversations with people who are actually interested in what you have to say.
Why Customer Segmentation Is a Game Changer

Let's face it: when you try to market to everybody, you end up connecting with nobody. Customer segmentation is what flips that script. It stops you from throwing your budget at campaigns that just don't land and turns your strategy into something much more precise.
Spending too much time on Excel?
Elyx AI generates your formulas and automates your tasks in seconds.
Sign up →Instead of seeing your audience as one giant, faceless blob, you start to see the distinct pockets of people within it. Imagine you run a subscription box service. Without segmentation, you'd send the same generic renewal email to every single subscriber. But with it, you can pinpoint the "at-risk" customers—the ones who haven't engaged in a while—and send them a special offer to win them back before they churn.
Unlocking Deeper Customer Understanding
This isn't just about a quick sales boost; it's about building real, lasting relationships. When you truly get the different needs and habits of each group, you can fine-tune everything from the products you develop to the support you offer.
For example, a software company might find it has two primary user segments:
- Power Users: These are the pros who crave advanced features and shortcuts. You can skip the basic tutorials and get right to showing them the cool, complex tools they'll love.
- Newcomers: This group is just getting started and needs a helping hand. A guided tour with step-by-step instructions and proactive support will build their confidence and keep them from getting overwhelmed.
By speaking directly to what each group needs, you're not just making their experience better—you're building loyalty and increasing their long-term value. It’s the difference between a generic "hello" and a personalized welcome that shows you get them.
The Growing Importance of Personalization
The push for this kind of personalized experience isn't just a passing trend; it's become a core part of a smart business strategy. The global market for customer segmentation tools is booming for a reason—businesses everywhere are realizing they need to connect with customers on a more targeted level.
This growth is being driven by powerful analytics that let companies segment customers using complex behavioral and psychographic data, going way beyond old-school demographics.
Ultimately, solid customer segmentation analysis helps you make smarter decisions everywhere in your business. To see just how powerful this can be, check out these practical 8 Customer Segmentation Examples and see how it all plays out in the real world.
Getting Your Data Ready for Segmentation in Excel
Any good segmentation analysis lives and dies by the quality of its data. This is the part everyone wants to rush through, but trust me, getting your data house in order before you start analyzing is the single most important thing you can do. It’s what separates a genuinely useful segmentation from a flawed one. We're not just talking about names and emails; we need data that actually tells us something about our customers.
A big part of this initial prep is simply getting all your information into one place. If you're pulling from multiple systems, it's worth brushing up on some data integration best practices to make the process smoother. Once everything is consolidated, we can roll up our sleeves and get to work in Excel.
What Information Should You Actually Collect?
When it comes to segmentation, not all data is created equal. The most powerful insights usually come from two key areas: what people buy and how they interact with you.
- Transactional Data: This is the hard evidence of customer behavior. Think purchase dates, how much they spent (order values), and what kinds of products they bought (product categories). It’s the "what, when, and how much" of their relationship with you.
- Engagement Signals: This is the softer side of the story. How often do they open your emails? How frequently do they visit your website? Do they submit support tickets? These cues tell you how plugged-in a customer really is.
I've seen companies completely change their strategy after digging into their historical sales data. By looking at past growth rates and where demand was coming from, they could pinpoint which segments were thriving and which were lagging. That kind of clarity is priceless when you're deciding where to put your resources.
My Go-To Data Cleaning Tricks in Excel
Okay, you’ve got your data in one spreadsheet. Now it’s time to clean it up. Messy data will trip up your formulas and PivotTables later, so a little effort now saves a ton of headaches. The good news is, you don't need to be an Excel wizard. For a complete rundown, you can always check out our guide on how to analyze data in Excel.
Here are a few functions I use constantly:
- The TRIM Function: Extra spaces are the silent killer of clean data. Use the formula
=TRIM(cell)to get rid of them. It's a lifesaver for standardizing things like names, emails, or any text field where spacing gets sloppy. - Text to Columns: This is a fantastic tool for breaking up data crammed into one column. A classic example is splitting a "Full Name" column into separate "First Name" and "Last Name" columns. So simple, yet so effective.
- Remove Duplicates: Duplicate entries will absolutely wreck your analysis. Thankfully, Excel has a dead-simple, built-in tool to find and zap them in seconds.
Here’s a look at the "Remove Duplicates" tool in action. It's a non-negotiable step for getting an accurate customer count.
Just select the columns that should be unique (like an email address or customer ID), and Excel does the rest. This ensures every customer is counted exactly once, which is the bedrock of a reliable segmentation.
Choosing the Right Segmentation Model for Your Business
Picking the right way to group your customers isn't about finding some magical, perfect formula. Let's be real—it's about matching the model to what you actually want to accomplish. There's no one-size-fits-all approach here. The goal is to stop thinking in abstract terms and start looking at your customers through a lens that makes sense for your business.
The most practical models come down to answering some simple, yet powerful, questions. Are you trying to figure out who your customers are? Where they are? Or maybe, most importantly, what they actually do? The answer will point you in the right direction.
Models That Drive Real Decisions
Let's cut through the noise and look at the most common and genuinely useful segmentation models you can put into action. Each one gives you a different, valuable perspective on the people who buy from you.
-
Demographic Segmentation: This is the classic "Who are they?" model. It groups people by concrete traits like age, gender, income level, or job title. It's direct, and thankfully, it’s often the easiest data to get your hands on.
-
Geographic Segmentation: This one is all about the "Where are they?" It slices your customer base by country, region, city, or even down to a specific neighborhood. If you have a physical presence or your product's appeal is tied to location, this is non-negotiable.
-
Behavioral Segmentation: This is arguably the most powerful model because it answers, "What do they do?" It focuses on tangible actions—purchase history, how they interact with your website, how often they use your product, and their loyalty to your brand.
Think about it this way: a local restaurant chain is going to get a ton of mileage out of geographic data to create neighborhood-specific deals. On the flip side, someone who sells online courses will lean heavily on behavioral metrics—like which lessons a user watches or how often they log in—to see what's working and what isn't.
The point of customer segmentation analysis isn't just to stick labels on people. It's to find real insights that lead to smarter marketing, better products, and customers who stick around. Choose the model that gives you the clearest path to taking action.
The chart below shows exactly why this matters. It visualizes how different segments can stack up on key business metrics like size, how often they buy, and their lifetime value.
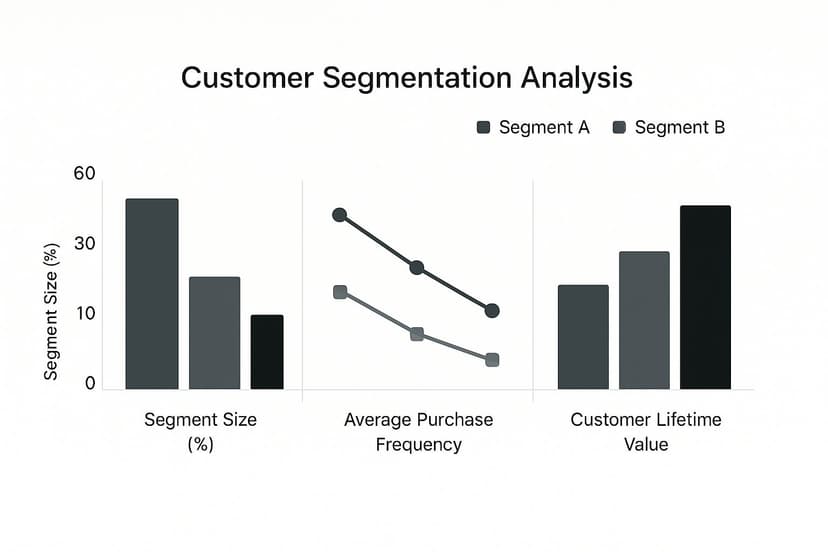
As you can see, the biggest segment isn't always the best. A smaller group might be way more valuable because they buy more often and have a much higher lifetime value. That's an insight you can act on immediately.
A Quick Comparison of Key Models
To help you decide, here’s a quick breakdown of the primary segmentation models, the core questions they answer, and the kind of data you'll need for each.
Comparison of Key Customer Segmentation Models
| Segmentation Model | Core Question | Common Data Points | Best For |
|---|---|---|---|
| Demographic | Who are my customers? | Age, gender, income, education, job title, marital status. | Broadly targeting ads, product development for specific life stages. |
| Geographic | Where are my customers located? | Country, state/province, city, zip code, climate, urban vs. rural. | Local marketing, regional product offerings, shipping logistics. |
| Behavioral | What do my customers do? | Purchase history, website clicks, feature usage, loyalty status, session frequency. | Personalizing user experience, identifying power users, re-engagement campaigns. |
| Psychographic | Why do my customers buy? | Lifestyle, values, interests, personality traits, opinions, AIOs (Activities, Interests, Opinions). | Brand messaging, content marketing, creating an emotional connection. |
Each of these models offers a unique lens. Often, the most powerful insights come from combining elements from two or more to get a richer, more complete picture of your customer.
Match Your Model to Your Data
The best model is also the one you can actually use with the data you have. It's no wonder marketers are all-in on this; industry data shows that around 70% of marketers are actively using segmentation. More impressively, a massive 80% of companies that segment their customers report a jump in sales, often by mixing criteria to get the full story. You can dig into more of these customer segmentation statistics to see the impact.
So, before you go any further, open up your spreadsheet and see what you've got. If your data is packed with purchase dates and order values, a behavioral model like RFM (Recency, Frequency, Monetary) is a fantastic place to start. If you have detailed info from sign-up forms, demographics could be your low-hanging fruit. Your existing data already holds the clues.
How to Build an RFM Model in Excel

Alright, this is where we roll up our sleeves. We're going to build a powerful RFM (Recency, Frequency, Monetary) model using just the tools you already have in Excel. Forget about needing expensive, specialized software for this. The real power comes from turning your existing transaction data into insights you can actually use. An effective RFM model is a cornerstone of behavioral customer segmentation analysis.
To get started, all you need is a basic transaction log. Think simple: a unique customer ID, the date of each purchase, and how much was spent. With just this raw data, we can calculate everything we need for our model.
Calculating the RFM Metrics
First things first, we need to distill that long list of transactions into our three core metrics for every single customer. The goal here is to create a new summary table where each customer gets one row, with dedicated columns for their Recency, Frequency, and Monetary values.
-
Recency (R): How long has it been since a customer last bought something? To figure this out, you'll find the most recent purchase date for each customer and subtract it from today's date. The formula
TODAY() - [Last Purchase Date]works perfectly, giving you the number of days since their last visit. Remember, a lower number is better. -
Frequency (F): This is just a simple count of how many times a customer has made a purchase. Excel's
COUNTIFSfunction is your best friend here. Use it to count how many times each unique Customer ID shows up in your transaction log. -
Monetary (M): What's the total lifetime value of each customer? The
SUMIFSfunction will make quick work of this, summing up all the purchase amounts for each specific Customer ID.
Once you’ve run these calculations, your summary table is good to go. You've successfully organized a mountain of raw data into a clean format that's ready for scoring and segmentation. For more tips on wrangling your datasets, check out our guide on effective data management in Excel.
Scoring Your Customers from 1 to 5
Now that you have your R, F, and M values for everyone, it's time to score them. A simple 1-to-5 scale is incredibly effective. We'll assign a score of 5 to your best customers (those who buy most recently, most often, or spend the most) and a 1 to those at the other end of the spectrum.
So, how do you decide where the score boundaries fall? You have a couple of solid options. One popular method is using percentiles—the top 20% of spenders get a Monetary score of 5, the next 20% get a 4, and so on. Or, you can set manual thresholds based on what makes sense for your business, which I often find more intuitive.
For instance, you might decide that anyone who purchased in the last 30 days automatically gets a Recency score of 5, while anyone who hasn't bought in over a year gets a 1. This kind of business-specific logic can provide much more tailored insights than sticking to rigid statistical splits.
Whichever path you choose, the end goal is the same: assign three distinct scores (one for R, one for F, and one for M) to every customer in your list.
Combining Scores and Defining Segments
This is the final and most exciting part—bringing it all together. A common practice is to simply concatenate the three individual scores to create a single, three-digit RFM score. A customer with R=5, F=5, and M=5 becomes a "555"—your undisputed champion. In contrast, a customer with a "111" score has likely gone dormant.
From here, you can define your customer segments. The good news is you don't need to overcomplicate things by analyzing all 125 possible score combinations. Instead, the smart move is to create broader, more actionable groups based on logical patterns in the scores.
Here are a few of the classic RFM segments I always start with:
| Segment | RFM Score Pattern | Characteristics |
|---|---|---|
| Best Customers | 555, 554, 545 | Bought recently, buy often, and spend the most. Your VIPs. |
| Loyal Customers | X5X (F is 5) | They come back again and again. Nurture this relationship. |
| At Risk | 2XX, 1XX (R is 1 or 2) | They used to be regulars but haven't been back in a while. Time for a win-back campaign. |
| New Customers | 51X (R is 5, F is 1) | Fresh faces who just made their first purchase. A critical group to engage and impress. |
By building a PivotTable from your newly scored customer list, you can instantly see the size and total value of each segment. This is the moment where raw data truly transforms into a clear, strategic map of your customer base—the very essence of powerful customer segmentation analysis.
Turning Your Segments into Marketing Actions
Finishing the analysis in your Excel sheet isn't the end of the road. Far from it. This is where the real work—and the real payoff—begins. You’ve put in the effort to calculate those RFM scores, and now it's time to put that data to work by crafting marketing strategies that actually resonate with people.
The whole point of this exercise is to stop shouting the same message at everyone. A generic, one-size-fits-all campaign is a wasted opportunity. What you've just done is create a roadmap to speak directly to the unique needs and behaviors of each customer group. A message for your "Best Customers" should feel worlds apart from one designed to win back an "At Risk" shopper.
A Playbook for Your Key Segments
So, what do you actually do with these segments? Let's walk through some real-world plays for the core RFM groups you’ve just identified. These are tangible campaigns you can build today.
-
Your "Best Customers" (Score: 555): These are your champions, the lifeblood of your business. The goal here isn't just to keep them buying; it's to make them feel valued and empower them to become advocates.
- Exclusive Access: Treat them like insiders. Give them early access to a new collection or an invitation to a pre-sale event. This isn’t about a discount; it's about reinforcing their status.
- High-Value Referrals: Set up a "give-get" program that feels substantial. When they refer a friend, give both of them a significant reward. Their personal endorsement is marketing gold.
-
Your "At Risk" Customers (Scores like 2XX or 1XX): This is a critical group. They used to be active, but they've gone quiet. You need to act before they're gone for good.
- Win-Back Offers: A targeted email with a compelling, time-sensitive offer can work wonders. Think of a subject line like, "It's Been a While! Here's 20% Off Your Next Order."
- Feedback & Re-engagement: Sometimes, just asking "why?" is the most powerful move. Send a simple survey asking for their feedback. It shows you value their opinion and can give you priceless insights into why they stopped buying.
The best marketing doesn't feel like marketing at all—it feels like a direct response to a customer's behavior. Your RFM analysis is the cheat sheet that tells you who deserves a thank you, who needs a gentle nudge, and who requires a compelling reason to come back.
Connecting Your Analysis to the Bottom Line
Ultimately, this whole process is about driving real business results. When you tailor your marketing actions, you stop wasting money on campaigns that don't land. Instead, you focus your resources where they’ll have the biggest impact. It’s no surprise that companies using this kind of behavioral segmentation often see a massive boost in ROI—sometimes as high as 77%—compared to untargeted efforts.
Getting these insights from your spreadsheet into your marketing channels is also getting easier. When teams can streamline their reporting, they can react much faster to changes in customer behavior. In fact, many of the principles for speeding up data workflows apply here. You can learn more about this in our guide to financial reporting automation. The goal is to make sure your hard work in Excel translates directly into measurable growth.
Frequently Asked Questions

Even with a step-by-step guide, jumping into customer segmentation analysis can bring up a few curveballs. I've gathered some of the most common questions I hear from people just starting out, along with practical answers to help you sidestep common hurdles.
Think of this as your quick reference for getting unstuck and making sure your segmentation work really hits the mark.
How Often Should I Update My Customer Segments?
There's no single right answer here—it really depends on the pulse of your business. If you're running a fast-paced e-commerce shop, I'd recommend doing a customer segmentation analysis quarterly. Customer tastes and buying habits can change quickly in that world.
On the other hand, a B2B business with a much longer sales cycle might only need to refresh its segments every six months or even once a year. A great rule of thumb is to always revisit your segments after a major product launch or a big marketing campaign to see how the needle has moved.
What Is the Biggest Mistake in Customer Segmentation?
By far, the most common pitfall I see is creating way too many segments. It’s tempting to get super granular and slice your customer base into a dozen tiny groups, but this quickly becomes a marketing nightmare. You can't possibly create unique, effective campaigns for all of them.
My advice? Start with 3-5 core segments that are clearly different from each other and large enough to matter.
Another classic mistake is relying only on demographics. Things like purchase history and customer behavior tell you so much more about what someone actually wants. But the absolute biggest error is doing all this work and then letting the analysis sit in a folder. Segmentation is a tool for action, not a report to be filed away.
Your goal should be to create segments that are not just insightful, but also practical. If you can't immediately think of how you'd market to a specific group, your segment is probably too complicated or not well-defined.
Do I Need Special Software for This Analysis?
Absolutely not. While there are plenty of sophisticated platforms out there, Microsoft Excel has more than enough horsepower to run a powerful customer segmentation analysis, especially when using the RFM model we've walked through.
You can get incredibly deep insights just by using tools you’re already familiar with, like PivotTables and basic formulas. At the end of the day, the quality of your data and the thinking behind your strategy matter far more than the software you use.
Ready to put your analysis on the fast track without ever leaving your spreadsheet? Elyx.AI is an AI-powered add-in for Excel that helps you clean data, generate insights, and build formulas using simple text prompts.
Get started with Elyx.AI today and you can turn that raw data into clear, actionable segments in a fraction of the time.
Reading Excel tutorials to save time?
What if an AI did the work for you?
Describe what you need, Elyx executes it in Excel.
Sign up