Master Excel Report Automation Today

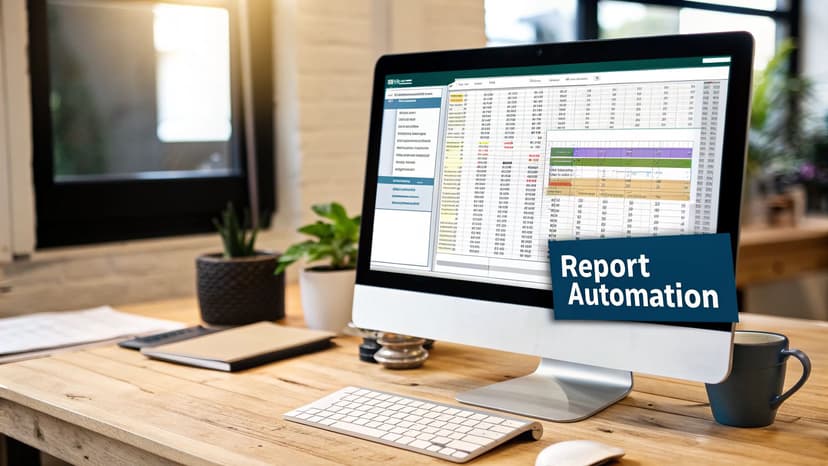
When we talk about automating Excel reports, we're really talking about using smart software to take over the repetitive, soul-crushing parts of data management. It's about letting a tool handle the grind of pulling, cleaning, and organizing raw data into a clean, ready-to-use report, all without you having to lift a finger. This simple shift can free up countless hours and dramatically cut down on those frustrating human errors, letting you focus on what really matters: analyzing the data, not just wrangling it.
Moving Beyond Manual Spreadsheets
We’ve all been there. It's late, and you're bleary-eyed, meticulously copying and pasting data from one spreadsheet to another, praying you don't mess up a cell. The modern workplace still runs on spreadsheets, but the manual grunt work behind them is a massive source of risk and inefficiency. Let's be real—spending your night fixing a broken VLOOKUP or tracking down a copy-paste error isn't the best use of anyone's talent.
This reliance on manual reporting is a tricky situation. Excel is comfortable and flexible, which is why it's so popular. But that same flexibility opens the door to major operational headaches. You might be surprised to learn just how common this is. Recent research from early 2025 found that around 58% of finance leaders are still using Excel as their main tool for reporting. This deep-seated habit often means juggling thousands of individual files, each one a potential landmine of errors and outdated information. You can dig deeper into finance automation trends to see just how widespread this challenge is.
Spending too much time on Excel?
Elyx AI generates your formulas and automates your tasks in seconds.
Sign up →The True Cost of Manual Reporting
The issue isn't just about the time you lose; it's about the opportunities you miss. Every hour you're stuck doing repetitive data chores is an hour you're not spending on spotting trends, exploring new business ideas, or thinking strategically. That constant loop of exporting data, cleaning it up, and formatting it just right keeps smart people buried in low-impact work.
This is precisely where excel report automation becomes a game-changer. It’s not just about convenience; it’s a strategic move. Tools like Elyx.AI are built to break you out of this cycle. They do the heavy lifting, putting you in the driver's seat to guide the analysis instead of just performing the labor.
To really understand the difference, let's look at a side-by-side comparison.
Manual vs Automated Excel Reporting at a Glance
| Factor | Manual Reporting | Automated Reporting |
|---|---|---|
| Time Investment | Hours or days of repetitive work | Minutes for setup, seconds for updates |
| Accuracy | Prone to human error (typos, formula mistakes) | High accuracy, consistent results |
| Scalability | Difficult to scale; more data means more work | Easily handles growing data volumes |
| Strategic Value | Focus is on data entry and formatting | Focus is on analysis and decision-making |
The table makes it clear: sticking with manual processes keeps you trapped in the weeds, while automation elevates your work to a more strategic, impactful level.
The real goal here is to shift your role from being a data processor to becoming a data strategist. When you automate the mundane tasks, you free up your mental bandwidth for the critical thinking that actually drives business forward.
Here’s a glimpse of what that looks like in practice. The Elyx.AI interface is designed to make complex data tasks feel simple, letting you use natural language to get things done.
As you can see, it integrates right into Excel. You get a simple, chat-based prompt bar where you can just type what you need—no more wrestling with complex formulas. This is how you end the tedious work and start building smarter, more efficient reports.
Setting Up Your Automation Workflow with Elyx.AI
This is where the real work begins—and where you start to see just how much time you can get back. Moving from the idea of automation to actually doing it is surprisingly painless. The first step in your excel report automation journey is simply getting Elyx.AI into your workspace by installing the Excel add-in.
Once it's installed, you’ll find the Elyx.AI interface fits right into the Excel environment you already know. The two main things you'll be using are the prompt bar and the analysis pane. I like to think of the prompt bar as my personal data assistant—I just type what I need in plain English, and it gets to work.
Connecting Your Data Sources
Let's be honest, real automation is only possible if you can easily get to your data, no matter where it's stored. Elyx.AI is built to connect to all sorts of sources, which means your reports can always pull the most current information. This completely gets rid of that tedious, error-prone cycle of manually downloading, importing, and exporting files.
I've seen clients connect their data in a few common ways:
- Local CSV or Excel Files: You can point Elyx.AI directly to files sitting on your computer. This is great for quick, one-off analyses or when you get regular data dumps sent over by email.
- SQL Databases: For bigger, more established systems, you can hook Elyx.AI directly into an SQL database. This lets it query live data, making your reports truly dynamic and always up-to-date.
- Cloud Platforms: So many teams live in Google Sheets or OneDrive these days. Elyx.AI can connect to these cloud services and pull data automatically whenever your team makes an update.
Think about a sales manager who needs to see daily performance. Instead of bugging the IT department for a new export every single morning, they can connect Elyx.AI to the company’s SQL database and have the report refresh itself automatically. Our full guide on Excel workflow automation walks through more specific examples of setting up these connections to save the most time.
This visual really captures the core benefits you get from a connected workflow.

The logic is simple but powerful: when you cut down on manual work, you automatically make your team more efficient and your reports more accurate.
Navigating the Interface
Okay, so your data is connected. Now it's time to get a feel for the interface. The main analysis pane is where you'll see everything happen. After you give it a prompt—something like, "Summarize sales by region and calculate the average deal size"—this pane is where the results will pop up.
It might show you a brand new pivot table, a list of the data-cleaning steps it just took, or even a chart visualizing the trends you asked about. This back-and-forth is what makes the tool so intuitive. You give an instruction, and Elyx.AI shows its work, which helps you trust it more with each command.
My advice? Start simple. Your first command doesn't need to be some grand, multi-step analysis. Try something basic like, "Remove all duplicate rows from this sheet" or "Format the 'Date' column to MM/DD/YYYY."
This is the best way to learn the rhythm of talking to the AI. You'll quickly get a sense of how it interprets your requests and turns them into actions in Excel. From there, you can start building up to more complex commands, layering instructions to build a complete report from raw data to a polished final product. This initial setup is the foundation for all the powerful automation you'll create later.
Creating Your First Automated Sales Summary
Let's get practical and walk through a real-world scenario. You've just been handed the raw monthly sales export. If you've ever been in this spot, you know the drill—it's a chaotic mess of inconsistent formatting, random empty rows, and jumbled data. Your job is to turn this into a clean, insightful summary for management, a task that could easily eat up your entire afternoon.
This is where Excel report automation completely changes the game. It turns hours of tedious clicking and formula-writing into a few simple, conversational commands. You stop being the one doing all the manual labor and become the one directing the work.
This shift is bigger than just Excel. The entire industrial automation market, which covers this kind of software-led efficiency, is projected to hit $226.8 billion in 2025. Companies jumping on board are reporting some serious wins, with many slashing operating costs by around 22%. It's a clear signal that this isn't just a fleeting trend but a core evolution in how modern businesses operate.
Cleaning Up Messy Data with Simple Prompts
First things first: you have to clean the data. The raw export is likely littered with extra spaces, mixed-up date formats, and duplicate entries. Instead of hunting them down one by one, you can just tell Elyx.AI what to do.
Think of it like giving instructions to a hyper-efficient assistant.
- You could say: "Remove all duplicate rows based on the 'Order ID' column."
- Then follow up with: "Trim all leading and trailing whitespace from the 'Customer Name' column."
- And finally: "Format the 'Sale Date' column to MM/DD/YYYY."
Boom. Each command is executed in a flash. A 30-minute data-cleaning headache is over in seconds. Getting this foundation right is crucial for making sure all your later calculations are accurate. If you want to dive deeper into these fundamental steps, our guide on how to automate your daily Excel tasks is a great place to start.
The interface itself makes the whole process feel incredibly intuitive, almost like you're just chatting with your spreadsheet.
As you can see, you type your request in plain English, and Elyx.AI handles the complex formulas and actions behind the scenes. It beautifully bridges the gap between what you want to do and how Excel actually does it.
Calculating Key Metrics Instantly
Once your data is sparkling clean, it's time for the fun part—the analysis. You need to pull key metrics like total revenue, the average deal size, and how many unique customers you had. Forget fumbling with SUMIF, AVERAGEIF, or COUNT formulas.
Instead, you just ask for what you need.
"Create a summary table. Calculate the total revenue from the 'Amount' column, find the average deal size, and count the number of unique customers from the 'Customer ID' column."
Elyx.AI gets it, runs the numbers, and drops a perfectly formatted summary table right into your worksheet. This is where you really feel the time savings stack up, freeing you to focus on what the numbers actually mean.
Summarizing Performance by Region
For the final touch, you need to see which sales regions are pulling their weight. Normally, this means building a pivot table, a feature that many Excel users find a bit intimidating.
With an AI-powered tool, it's just another simple request. You can type: "Create a pivot table showing the total sales amount for each region. Sort the regions by sales from highest to lowest."
And just like that, you have a clear, sorted pivot table highlighting regional performance. You've gone from a messy spreadsheet to a polished, actionable report using just a handful of simple sentences. This isn't science fiction; it's the new, smarter way to handle Excel reporting.
Putting Your Reports on Autopilot
So, you’ve built an amazing automated report. That's a huge win, but let's be honest, the real magic happens when you can truly set it and forget it. This is where we move beyond just simplifying a one-time task and create a workflow that runs itself, feeding you fresh insights without you ever having to lift a finger.
Think about it: instead of the Monday morning scramble to refresh your sales report, you can have Elyx.AI do the heavy lifting for you. You can schedule the entire process—daily, weekly, monthly, you name it. Imagine waking up on a Monday to find the weekly sales summary, fully updated and analyzed, already sitting in your inbox at 7 AM. That’s the goal.
Setting a Recurring Schedule
Getting this set up in Elyx.AI is surprisingly straightforward. The scheduling feature is designed to be intuitive, letting you pick the exact frequency and time for your report to run with just a few clicks.
I've seen clients use this for all kinds of reporting cadences. For instance:
- Daily Huddle Report: Many teams schedule a run for 6 AM every morning. This way, they capture all the overnight performance data and have it ready for their first meeting.
- Weekly Performance Review: A common setup is to run this every Friday afternoon. The report is then primed and ready for the Monday morning leadership sync.
- Monthly Financial Close: For finance teams, a monthly run on the first business day of the month is perfect for processing all of the previous month's data automatically.
Once you’ve set the schedule, Elyx.AI takes over completely. It will connect to your data source, grab the latest information, and rerun every single cleaning and analysis step you've already defined. The output is a perfectly updated report, generated with pinpoint accuracy, every single time. The time savings are very real, too. Some users I've talked to at large companies report getting back two to three hours per week, which they can then put toward work that actually requires their expertise.
The biggest advantage here is consistency. Automation completely eliminates the "oops, I forgot" or "I was too swamped" factor. Your stakeholders get the information they depend on, right when they expect it, without fail.
Automated Distribution to Stakeholders
A report gathering digital dust on your hard drive isn't doing anyone any good. The final piece of this puzzle is getting the insights into the hands of the people who need them. We all know the pain of manually emailing updated files—it’s tedious, and it’s easy to send the wrong version or leave someone important off the list.
This is where Elyx.AI really closes the loop. It can be set up to automatically email the finished report to a specific list of people the moment the scheduled update is finished. Decision-makers get the most current data delivered straight to their inbox, turning your report from a static spreadsheet into an active, reliable stream of business intelligence. This is what true, end-to-end excel report automation really looks like.
Taking Your Automation to the Next Level
Once you've got the hang of basic summaries and scheduled updates, you're ready to get into the really powerful stuff: advanced excel report automation. This is where we stop thinking about simple data dumps and start building dynamic, interactive intelligence tools that actually drive big decisions. It’s all about creating reports and visuals that an executive can look at and immediately understand.
This isn't just a niche skill anymore. The demand for smarter, more efficient processes is exploding. In fact, the industrial automation market is projected to skyrocket from USD 169.82 billion to USD 443.54 billion between 2025 and 2035. That’s a clear signal that businesses everywhere are hunting for ways to work smarter. You can dive deeper into this trend by checking out the full market research report.
Create Dynamic Dashboards and Intricate Charts
Think about a dashboard that updates itself in real-time, showing your most important KPIs the second new data hits the spreadsheet. With a tool like Elyx.AI, you don’t need a data science degree to make that happen. You can simply ask for complex visuals using plain English—the kind of charts that used to take hours of wrestling with Excel.
Let's say you're a marketing manager. You could try a prompt like this:
"Generate a line chart showing website traffic vs. conversion rate over the last 90 days. Add a trendline for each metric and highlight the week with the highest number of conversions."
Just one sentence can give you a crystal-clear visual on campaign performance. You can also build out performance comparison graphs to track how different products are selling or how sales teams are performing against their goals, all without touching a single pivot table manually.
Produce Executive-Ready PDF Reports
We've all been there. You have the data, but now you need to package it into a clean, shareable PDF for stakeholders. Manually exporting, formatting, and arranging multi-page reports is a soul-crushing task, especially when it’s a weekly ritual. This is where advanced automation becomes a lifesaver.
You can tell Elyx.AI to assemble specific charts, data tables, and your written summaries into a polished, multi-page document.
- Page 1: A high-level executive summary with top-line KPIs.
- Page 2: A deep dive into regional sales performance, broken down by territory.
- Page 3: Trend analysis charts for your most important product lines.
The result is a professional, consistent report every single time, without all the manual busywork of cutting, pasting, and exporting.
Pro Tip: For workflows you use over and over, create a reusable "recipe" in Elyx.AI. A recipe is just a saved sequence of prompts. For instance, you could build a "Monthly Financial Health Check" recipe that you can run on datasets from different departments with a single click.
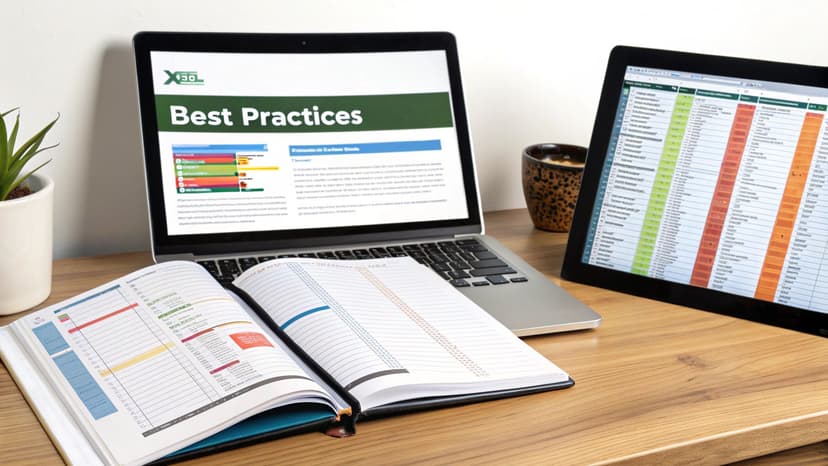
This method lets you apply your best analysis across the entire organization, making sure everyone is working from the same playbook. Our complete guide on excel reporting automation digs into even more strategies for creating these scalable systems. By adopting these advanced techniques, you graduate from being just a user to a genuine power user—someone who can deliver real, high-impact business intelligence.
Got Questions? We’ve Got Answers
Stepping into the world of Excel report automation can feel like a big leap. It’s totally normal to have a few questions before you dive in. After all, you're changing a process you probably know like the back of your hand. We've heard a lot of the same concerns from people just like you, so we’ve put together some straight answers to help you get comfortable with the idea.
Think of this as a quick conversation to clear up any uncertainties. Our aim is to show you just how smoothly a tool like Elyx.AI can slot into your day-to-day work, helping you get past those reporting headaches and win back your time, right from the start.
What About My Reports With Really Complex Calculations?
Absolutely. This is probably the number one question we get, and the answer is a resounding yes. Modern AI tools are specifically designed to handle the heavy lifting.
Think about those multi-step formulas, messy data transformations, or tricky conditional logic that take forever to get right. With a platform like Elyx.AI, you can manage all of that using simple, natural language. Just tell the AI what you need—whether it’s running a VLOOKUP, creating a pivot table from scratch, or applying a custom calculation—and it does the work for you.
The real game-changer here is that you get to stop worrying about how to build the formula and just focus on what you want to discover from your data. The AI takes care of the technical side.
How Do I Know My Data Is Secure?
We get it—your data is your most valuable asset. Security is non-negotiable, and it’s the bedrock of any trustworthy automation tool.
With Elyx.AI, for example, everything happens right inside your own Excel environment. This design choice dramatically minimizes how much your data has to travel, which is a huge security plus. All the processing is handled with enterprise-grade security protocols designed to keep your information locked down.
As a rule of thumb, you should always give any new tool's security and privacy policies a once-over. But you can rest assured that for any reputable platform, protecting your data isn't an afterthought; it's a core feature.
Do I Need to Be a Tech Whiz to Use This?
Here’s the best part: not at all. One of the biggest wins of using AI-powered automation is that it gets rid of the old technical hurdles. Gone are the days of needing to be a VBA macro guru or a coding expert to automate a task.
Honestly, if you can explain your reporting process out loud to a colleague, you have all the skill you need. It’s all about describing the result you want, not programming the steps to get there. This opens up Excel report automation to your entire team, not just the person with "IT" in their job title.
Ready to finally put an end to manual reporting and focus on the work that actually moves the needle? Elyx.AI is like having an AI assistant right inside Excel, ready to clean data, whip up summaries, and build reports from simple, everyday language.
Start your free trial of Elyx.AI today!
Reading Excel tutorials to save time?
What if an AI did the work for you?
Describe what you need, Elyx executes it in Excel.
Sign up