Excel Workflow Automation Your Productivity Guide

When you hear "Excel workflow automation," you might picture complex scripts and coding. At its core, it's simply about using smart tools to take over the repetitive, mind-numbing tasks you do in spreadsheets every day—things like cleaning data, running reports, or translating text.
The real goal here is to stop the manual grind. It saves a massive amount of time, cuts down on human error, and, most importantly, frees up you and your team to focus on work that actually requires brainpower.
The True Cost of Manual Excel Workflows

Spending too much time on Excel?
Elyx AI generates your formulas and automates your tasks in seconds.
Sign up →Before we jump into the how, it’s important to get a gut-level understanding of why this matters so much. Sticking with manual Excel processes isn't just a drain on your time; it's a hidden tax on your business's ability to move quickly and make accurate decisions.
The real cost isn’t just about the hours you spend copying, pasting, and reformatting. It’s about the opportunities you miss, the flawed strategies you build on bad data, and the operational friction that keeps your team from hitting its stride. Think about the ripple effect of one tiny mistake—a typo in a sales forecast can throw off inventory orders, leading to costly overstock or frustrating stockouts. It's a daily reality for businesses buried in manual spreadsheet work.
The Scope of Manual Process Risk
You might be surprised at how many companies are in the same boat. The reliance on manual Excel tasks is staggering, creating serious operational risks that often fly under the radar. For instance, a Forrester survey uncovered that 82% of organizations still depend on manual processes routed through spreadsheets.
Some businesses are juggling as many as 10,000 separate Excel files for critical operations. At that scale, trying to manage everything by hand is a recipe for disaster. You can explore more business process automation statistics to see just how deep this challenge runs.
This reality creates a clear tension. While old habits die hard, the push for a better way is strong, with 31% of companies now prioritizing workflow automation to sharpen their operations.
The biggest problem with manual Excel work is that it turns your sharpest people into human glue. Instead of analyzing, strategizing, and innovating, their expertise gets bogged down in repetitive, low-impact tasks.
Quantifying the Hidden Costs
Let's get specific about the costs—both the obvious and the hidden ones. The fallout from sticking with the old way goes far beyond just wasted time.
- Sky-High Error Rates: Anytime a human is manually entering or moving data, mistakes are inevitable. Even a seemingly tiny 1% error rate can have massive financial consequences when you're dealing with large datasets.
- Crushed Productivity: It’s a sad fact that skilled analysts often spend up to 80% of their time just wrangling and cleaning data. That leaves precious little time for the actual analysis—the part of the job they were hired for.
- Zero Scalability: A manual process that works for a hundred rows of data will completely crumble when faced with a hundred thousand. As your business and your data grow, these workflows become completely unsustainable.
To really see the difference, let's put the two approaches side-by-side.
Manual vs Automated Excel Workflow At a Glance
This table offers a clear snapshot of what you gain by moving away from manual processes. The differences in efficiency, accuracy, and growth potential are stark.
| Metric | Manual Workflow | Automated Workflow |
|---|---|---|
| Time Investment | High; hours or even days per cycle. | Low; minutes to run and refresh. |
| Error Rate | High; incredibly prone to human mistakes. | Near-zero; consistent and repeatable every time. |
| Scalability | Poor; chokes on large or growing datasets. | Excellent; handles data growth with ease. |
Ultimately, automation isn't just about doing the same work faster. It's about fundamentally changing how work gets done, creating a more resilient, accurate, and scalable operation.
Automate Data Prep with Excel's Built-In Tools
You might be surprised by how many powerful automation tools are already sitting inside the Excel you use every day. Before you even think about third-party solutions, it’s worth getting familiar with the capabilities hiding in plain sight. This is the best place to start building a solid automation foundation without any extra cost or software.
The real star here is Power Query, which you'll find under the "Get & Transform Data" section of the Data tab. I like to think of it as a VCR for your data prep work. It records every single action you take—removing columns, fixing data types, splitting text—and lets you replay that entire sequence on new data with just one click.
A Practical Scenario: Combining Monthly Reports
Let's imagine you're a sales analyst. Every month, you get a separate Excel file from each sales region. Your job is to manually open each one, copy the data, and paste it into a massive "master" file. Then you have to clean it all up before you can even start your analysis. It's tedious, takes forever, and is practically begging for a copy-paste error to slip through.
This is exactly where Power Query shines. Instead of that manual slog, you can point Excel directly to the shared folder where all those regional reports are saved. Power Query will then go in, grab every file it finds, and automatically stack them into a single, unified table for you.
The real magic of Power Query is that it creates a repeatable process. You aren't just cleaning today's data; you're building a system that will clean your data perfectly, every single time, from now on.
The first step is always spotting these routine chores, which is the key to unlocking massive time savings, as the workflow below illustrates.
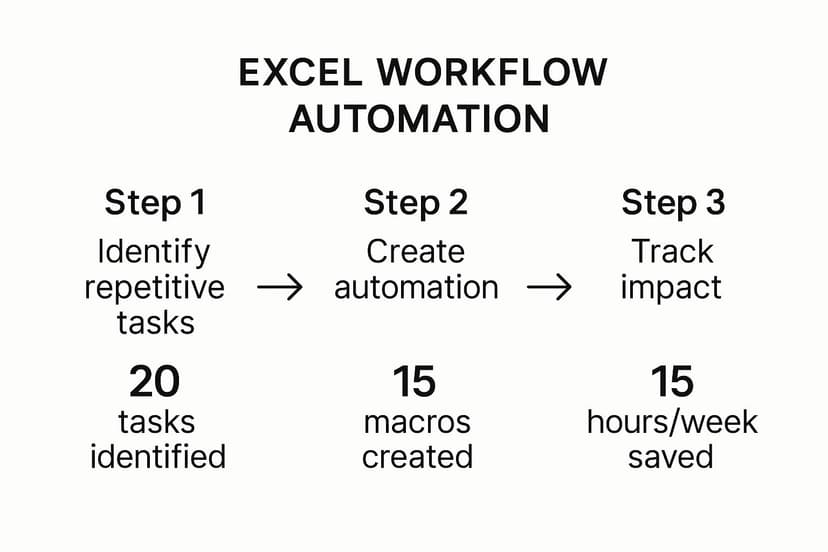
As you can see, simply identifying a repetitive task is the trigger for an automation that can free up a huge chunk of your workweek.
Applying Repeatable Transformation Steps
Once Power Query is connected to your data folder, you’ll enter the Power Query Editor. This is where the automation gets built. Every click you make from this point forward is recorded as a step in your data-cleaning recipe.
Here are a few common steps you might take:
- Remove Unnecessary Columns: Get rid of clutter. Click on the columns you don't need for your final report, like internal tracking codes or superfluous notes, and remove them.
- Correct Data Types: This is a big one. Make sure columns with dates are actually formatted as dates and that numbers are recognized as numbers, not text. Your calculations will fail without this.
- Filter Out Irrelevant Rows: You can easily filter out rows you don't need, like sales with a zero value or specific product lines that aren't part of your current analysis.
- Add Custom Columns: Need to calculate profit? You can create a new column on the fly by telling Power Query to subtract your "Cost" column from your "Revenue" column.
Once you’ve gone through all your cleaning and shaping steps, you just hit "Close & Load." Power Query drops a perfectly clean, consolidated table right into a new sheet in your workbook.
Here’s the best part. Next month, when the new batch of sales files land in that folder, you don't have to do any of this again. You just go to the Data tab and click Refresh All. In seconds, Power Query re-runs all your recorded steps on the new data, instantly updating your master table.
This simple refresh is the heart of effective automation inside Excel. For more in-depth examples, our complete guide on how to automate Excel breaks down even more techniques you can use.
Go Beyond the Basics with AI-Powered Automation
While built-in tools like Power Query are fantastic for the heavy lifting of data prep—cleaning, combining, and shaping your datasets—they eventually hit a wall. They can organize your information perfectly, but they can't understand it. True next-level excel workflow automation requires adding a layer of intelligence that can interpret the actual content inside your cells. This is exactly where AI-powered add-ins like Elyx.AI shine.
They pick up where native Excel tools leave off, tackling complex analytical jobs that used to require specialized software or, more often, a ton of manual effort. We’re making a shift from just preparing data to genuinely understanding what it means.
From Structure to Insight with AI
Let’s get practical. Imagine you run an e-commerce business selling products worldwide. You're getting hundreds of product reviews every week, but they’re in Spanish, French, German, and Japanese. With standard Excel tools, that data is just a wall of text. It's impossible to analyze at scale unless you're willing to painstakingly translate each review by hand.
This is a perfect scenario for an AI tool. Instead of burning days on manual translation, a simple Elyx.AI formula can knock out the entire task in minutes. By applying a formula like =ELYX.AI("Translate this text to English", [cell_with_review]) to a column of multilingual feedback, you can instantly generate a clean English translation for every single review.
This kind of language-based automation opens up a whole new world. It’s not just about cleaning data anymore; it's about making sense of it. For a deeper look into this approach, you can explore more ideas for advanced spreadsheet automation.
The screenshot below shows another powerful example: using Elyx.AI to generate summaries from a large dataset. Think about how much time that would save compared to doing it manually.
This visual really captures the power of asking the AI to find insights for you, turning raw numbers into actionable summaries without you needing to build complex formulas.
Automating Nuanced Analytical Tasks
The real magic happens when you start chaining these AI capabilities together. Once you have all your customer reviews translated into English, you can take the next step and perform sentiment analysis.
With another straightforward formula, you can ask the AI to assign a sentiment score—like "Positive," "Negative," or "Neutral"—to each translated review. All of a sudden, you have a structured, quantifiable metric that tells you exactly how customers feel about your products.
This is the fundamental shift. You’re no longer just managing data; you’re automatically extracting nuanced, human-centric insights from it. You can quickly spot which products are getting negative feedback and why, without having to read thousands of individual comments.
This push for smarter process enhancement is driving huge market trends. The global workflow automation market is expanding rapidly as companies look to slash errors and boost productivity. The market was valued at around $29.9 billion in 2025 and is expected to skyrocket to $87.7 billion by 2032, a surge largely fueled by integrating AI and machine learning into these platforms. You can dig into more insights about the workflow automation market on coherentmarketinsights.com.
By combining translation, sentiment analysis, and even summarization, you can build a completely automated workflow. It turns raw, multilingual customer feedback into a concise, actionable report—all within the familiar environment of Excel. This is the future of smart excel workflow automation.
Build Dynamic Reporting Dashboards That Update Themselves

This is where all the groundwork really pays off. After automating your data cleaning with Power Query and enriching it with Elyx.AI, you can build an insightful reporting dashboard that basically runs itself. We’re connecting all the dots to create a central hub for your business intelligence that stays current without manual intervention.
Think about the old way of doing things: hours spent every week or month pulling reports, fixing data, and then painstakingly building charts. That’s over. Now, you build the system once, and it becomes a living tool that gives you back all that time.
Fueling Your Dashboard with Automated Data
A great dashboard is only as good as the data feeding it. Fortunately, you’ve already built a rock-solid foundation. Your Power Query connection is the engine, pulling in raw data and cleaning it up based on the rules you defined. The extra columns you added with Elyx.AI—like sentiment scores or translations—are the high-octane fuel, adding layers of valuable insight.
When you link everything together, the entire reporting structure becomes dynamic. Here’s how the automated chain reaction works:
- New data arrives: You drop new raw files, like the latest monthly sales report, into a specific folder.
- Power Query takes over: When you hit refresh, it automatically grabs those new files, applies all your cleaning steps, and loads the pristine data.
- Elyx.AI adds the magic: The formulas you set up instantly analyze any new rows, adding insights like customer sentiment or product categories.
This seamless pipeline feeds your dashboard directly, making manual updates a relic of the past.
The real objective here isn't just to make a few charts. It's to create an ecosystem where the charts refresh themselves. One click on 'Refresh All' should set off a cascade, updating every single table and visual on your dashboard with the most current information.
Visualizing Your Insights with PivotTables and Charts
With your automated data model ready to go, building the front-end visuals is the easy part. This is where Excel’s native PivotTables and PivotCharts shine. They are designed to summarize massive datasets, which makes them perfect for dashboards.
Just drag and drop the fields you need. Want to see sales trends by region? Or maybe track the ratio of positive to negative customer feedback over time? A PivotTable can create that summary in seconds.
And the best part? Because your PivotTables are built on that automated data source from Power Query, they inherit its dynamic nature. When you refresh your data connection, every PivotTable and PivotChart tied to it updates instantly. Imagine your weekly performance dashboard populating itself with the latest numbers every Monday morning before you’ve even had your coffee.
If you want a more detailed guide on the specifics, our post on creating an Excel dashboard tutorial walks you through the entire process.
By combining the clean, structured data from Power Query, the deep insights from Elyx.AI, and the visualization power of PivotTables, you've turned a simple spreadsheet into a powerful, automated business intelligence tool. This is the final step that delivers consistent, ongoing value from your excel workflow automation efforts.
Keeping Your Automation Running Smoothly for the Long Haul
You’ve built an automated workflow. That’s a huge win. But the real test isn't just getting it to run once; it's making sure it stays reliable and effective over time. What you're aiming for is a system so straightforward that a teammate could take it over with just a quick walkthrough.
The long-term health of your excel workflow automation really comes down to planning for the unexpected. I’ve learned from experience that automations rarely break because the core logic is wrong. It's almost always something external you didn't see coming—a source file gets renamed, someone adds a new column to a monthly report, or an entire folder moves to a different server. Any of these can bring a perfectly good system to a screeching halt.
This is why a few best practices aren't just good ideas; they're absolutely necessary if you want your work to last and scale.
Build Your Automations to Last
To sidestep those common headaches, you need to build with clarity and flexibility from the start. It’s about thinking past what works right now and considering what might change tomorrow.
- Document as You Go: Inside Power Query, get into the habit of using the "Properties" box for each step. Just add a quick note explaining what that step does and why you did it. This leaves a breadcrumb trail that makes perfect sense to anyone who opens the file later, including your future self.
- Embrace Named Ranges: Don't tie your formulas to static cell ranges like
A1:F500. Use Named Ranges instead. Why? Because when you add new rows or columns, the named range expands automatically, keeping all your formulas and charts from breaking. It’s a simple trick with a huge payoff. - Demand Consistent Source Files: This is a big one. Make sure the structure of your source data—especially column headers and their order—doesn't change. Any unexpected shift here is a primary cause for Power Query steps to fail.
The best automations are built defensively. Just assume file paths will change, columns will be tweaked, and someone else will eventually have to figure out what you built. If you design for that reality from day one, you’ll be in great shape.
Turn Automation into a Team Effort
Truly robust automation isn't a solo mission; it becomes a shared asset. When you build systems that others can easily understand and maintain, you're contributing to a much larger culture of efficiency. The impact is felt organization-wide. Don't just take my word for it—data shows that 83% of IT leaders see workflow automation as essential, and it's no wonder when 90% of knowledge workers report it improves their day-to-day job. You can dig into more of these trends and see how businesses are adopting automation at kissflow.com.
At the end of the day, maintaining your automation is all about discipline. Resisting shortcuts, like hard-coding a file path or creating a massive, indecipherable query, will save you and your team countless headaches. A well-documented and logically built workflow isn't just easier to fix—it’s a valuable, scalable asset for everyone.
Your Excel Automation Questions Answered

Jumping into Excel workflow automation for the first time naturally brings up a lot of questions. I see it all the time. People wonder if they have the right skills, or if they’re even picking the right tools for what they want to accomplish. Let's clear up some of the most common uncertainties I hear so you can get started with confidence.
One of the biggest myths holding people back is the idea that automation is just for coders.
Is Excel Automation Only for Coders?
Absolutely not. That might have been true years ago when VBA macros were the only game in town, but modern tools have completely changed the landscape.
Take Power Query, for instance. It’s built around a visual, intuitive interface where every click you make—cleaning a column, filtering data, merging tables—is recorded as a repeatable step. It feels less like programming and more like using a well-designed app.
Then you have AI add-ins like Elyx.AI, which are designed to work with simple, plain-English formulas. This guide focuses entirely on these user-friendly approaches. The point is, you can achieve some truly powerful automation without ever writing a single line of code.
Power Query vs. AI Tools: When to Use Each
This is a fantastic question, and the answer isn't "one or the other." They actually work brilliantly together. I like to think of it this way:
-
Power Query is for structure. It’s your workhorse for all the foundational tasks. Use it for cleaning, combining, filtering, and shaping your datasets. It’s the best tool for getting your data organized and ready for analysis.
-
AI tools are for insight. An AI tool like Elyx.AI shines when you need to understand the content within your data. Think of tasks that require interpretation, like translating text, analyzing customer feedback for sentiment, or generating written summaries from raw numbers.
An incredibly effective workflow I often recommend starts with Power Query to prepare the raw data, followed by an AI tool to analyze and interpret it. This combination covers both the structural and the analytical sides of your project, giving you a complete automation solution.
What Are the Biggest Mistakes to Avoid?
From my experience, the single biggest mistake is not designing your automations with the future in mind. It's easy to build a process that works perfectly today but shatters the moment something changes.
A classic pitfall is hard-coding file paths. Your automation works great until someone renames or moves a folder, and then the whole thing breaks. A much more resilient approach is to have your query pull data from a folder source instead of a specific file.
Another common issue I see is creating one gigantic, overly complex query. It’s far better to break your process into smaller, logical queries that feed into each other. This makes troubleshooting a thousand times easier. And finally, always document your steps and logic. A few quick notes will be a lifesaver when you or a colleague has to revisit the workflow months down the line.
Ready to move beyond basic automation and add real intelligence to your spreadsheets? Elyx.AI integrates powerful analysis, translation, and data cleaning directly into Excel, all through simple formulas and conversation. Start your free trial and see what AI can do for your workflows.
Reading Excel tutorials to save time?
What if an AI did the work for you?
Describe what you need, Elyx executes it in Excel.
Sign up