Smarter Excel Reporting Automation

Excel reporting automation is all about using smart tools to handle the repetitive, manual tasks that eat up your day. Think about it: instead of manually entering data, merging files, and fiddling with formatting, you can set up a system that does it all for you. This turns your static spreadsheets into living, breathing reports that update themselves, saving a ton of time and cutting down on those all-too-common human errors. Tools like Elyx.AI are making this level of automation surprisingly easy to achieve, even for those of us who live and breathe Excel.
Escape the Manual Reporting Grind
If you’ve ever found yourself staring at the clock on a Friday afternoon, still trying to merge sales data from three different CSV files into one master spreadsheet, you know the pain. It’s a tedious, mind-numbing process that's a universal headache for analysts, managers, and pretty much anyone who has to turn raw numbers into a clean report. The grind isn't just boring; it’s a real business risk.
This endless cycle of downloading, copying, pasting, and reformatting is a breeding ground for mistakes. A single misplaced decimal point or a broken VLOOKUP can throw off an entire financial forecast, potentially leading to some seriously bad decisions. The hidden cost is huge, not just from the errors themselves but from the sheer amount of time wasted. Every minute you spend on data grunt work is a minute you aren't spending on strategic analysis—the part of your job that actually matters.
Spending too much time on Excel?
Elyx AI generates your formulas and automates your tasks in seconds.
Sign up →The Real Cost of Manual Work
Picture a financial analyst putting together a weekly performance report. They have to pull data from the company CRM, an inventory system, and a separate spreadsheet for regional sales. Of course, each source has its own quirks and formatting. The analyst burns hours just trying to standardize date formats, clean up messy text entries, and get the columns to align before they can even think about building a pivot table. This isn't just inefficient; it’s a bottleneck that keeps critical insights from getting to the people who need them.
The real issue here is that manual Excel work just doesn't scale. As your business grows, your data grows with it. What was a manageable task a year ago can quickly become an overwhelming burden, tying up your best analytical people with low-value data janitorial work.
A Smarter Way to Work
This is exactly why Excel reporting automation has become a practical necessity, not some far-off luxury. This shift is mirrored in the market itself. The global office automation market, which covers these kinds of tools, was valued at around USD 103.62 billion and is expected to keep growing, largely because companies need better ways to manage and analyze their data. You can dive deeper into the numbers by checking out the full research on this growing market trend.
Solutions like Elyx.AI were built to tackle this problem head-on, right inside the Excel interface you already know. Instead of wrestling with complex scripts or brittle VBA macros, you can use simple, AI-driven commands to automate your entire workflow—from fetching and cleaning data to summarizing it and exporting the final report. In this guide, I'll walk you through how to set up these kinds of systems to get your time back and start building reports you can actually trust.
Prepare Your Data for Flawless Automation
Any experienced analyst will tell you: automation is only as good as the data you feed it. It’s a simple truth, but it’s also the most overlooked part of any Excel reporting automation project. Before you can dream of a sleek, self-running report, you have to get your hands dirty and build a rock-solid data foundation.

Think of it like this: you can have the most advanced kitchen in the world, but you can’t make a great meal with unwashed, mismatched ingredients. The same principle applies here. Messy data—inconsistent column names, mixed date formats, random extra spaces—is the number one reason automated workflows fail. A machine, unlike a person, can't guess what you mean; it needs absolute consistency to do its job correctly every single time.
This critical preparation stage, sometimes called data sanitization, is where you guarantee every piece of information is ready for processing. It’s the difference between a reliable report that runs like clockwork and one that constantly breaks down, leaving you to pick up the pieces.
Standardize Your Data Structure
Let's walk through a real-world scenario. You’re pulling a monthly sales export from your company's CRM. In January, the main sales column is labeled "Total_Revenue." In February, it comes through as "Sales (USD)." To you, they're the same thing. To an automation tool? It’s a showstopper. Your entire workflow will grind to a halt.
This is where creating a standardized data template becomes your secret weapon. Before you even touch an automation tool, define the exact structure your data must follow.
- Consistent Column Headers: Decide on one—and only one—official name for each column. For instance, always use "OrderID" instead of letting "Order #" or "Order_ID" slip in.
- Uniform Data Formats: Get religious about formats. All dates should be MM/DD/YYYY, and all currency values should use the same symbol and decimal placement. No exceptions.
- Clean and Tidy Cells: Remove any leading or trailing spaces; they’re invisible troublemakers that can wreak havoc. And please, no merged cells. They are notoriously difficult for automated systems to read.
This might feel like tedious upfront work, but I can't stress enough how much it pays off. From my experience, spending one hour standardizing your data template will save you at least ten hours of troubleshooting broken automations down the line. It's the single most important step for long-term success.
This disciplined approach is essential, yet it's surprising how many businesses still struggle here. In fact, a recent FlowForma report on process automation challenges found that around 82% of organizations still rely heavily on manual processes in Excel. This dependence on manually handled data creates massive operational risks and inefficiencies.
Automating the Cleanup Process
Now for the good news: you don't have to be a data janitor, manually cleaning your files every single time. This is where a tool like Elyx.AI really shines, as it can automate the preparation stage itself. You can build a repeatable "cleanup" workflow that automatically handles all those inconsistencies for you.
Imagine giving Elyx.AI a simple set of commands to:
- Standardize all dates to your chosen format.
- Trim all whitespace from every text-based cell.
- Find every instance of "NY" and "New-York" and replace them with "New York."
This turns what used to be hours of tedious, error-prone work into a process that runs flawlessly in minutes.
The time savings here aren't just marginal; they're substantial. When you remove the manual grind from data prep, you free up your team to focus on analysis, not just data entry.
Manual vs Automated Data Cleaning Time Investment
| Manual Task | Typical Time (Per Report) | Automated with Elyx.AI | Time Saved |
|---|---|---|---|
| Fixing Column Headers | 15-20 minutes | < 1 minute | ~95% |
| Standardizing Date Formats | 20-30 minutes | < 1 minute | ~98% |
| Removing Extra Spaces | 10-15 minutes | < 1 minute | ~90% |
| Correcting Inconsistent Terms | 25-45 minutes | < 2 minutes | ~95% |
As the table shows, automating the cleanup process with a dedicated tool drastically cuts down on prep time, giving you a pristine dataset every single time. Building this clean foundation is not just a best practice; it's a cornerstone of effective data management in Excel and the key to unlocking true automation.
Build Your First Automated Report Workflow
Now that your data is clean and standardized, we get to the fun part: building your first automated workflow. This is where you’ll turn that static spreadsheet into a living, breathing report that updates itself. We're going to use Elyx.AI to set up a simple but effective automation that pulls in data, summarizes it, and runs some basic analysis—all without you having to click a single cell.
Don't think of this as coding. It's more like giving a series of clear, simple instructions to a really smart assistant. The aim is to create a repeatable set of steps that Elyx.AI can run on its own, freeing you from the soul-crushing routine of manual report building. Once you get the hang of this, you'll have the confidence to build much more sophisticated reports down the line.
Here’s a quick look at the basic flow to get your automation off the ground.
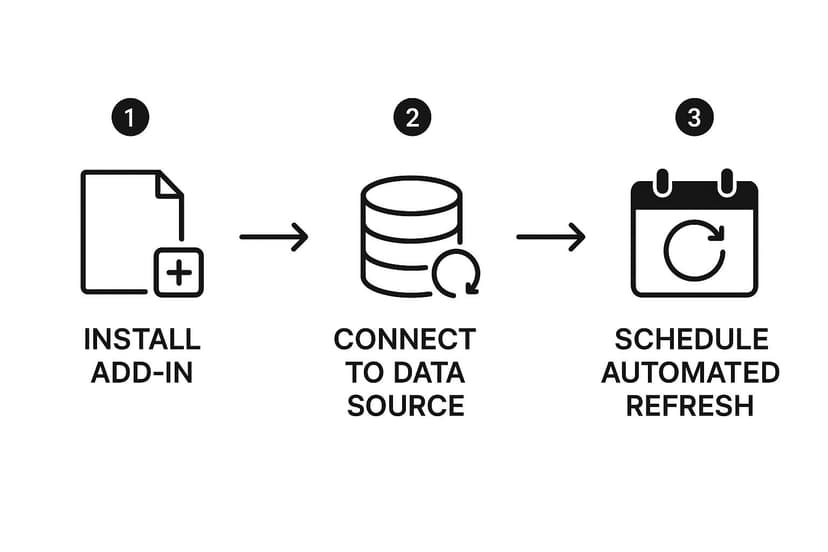
As you can see, it’s a pretty straightforward journey from initial setup to a scheduled, hands-off report.
From Raw Data to Actionable Insights
Let's walk through a real-world scenario. Say your goal is to create a monthly sales summary. Right now, you probably have a data file with columns like SaleDate, Product, Region, and Amount. The manual process involves opening the file, creating a pivot table, filtering for the right month, and then pasting the results into your final report. With Elyx.AI, every single one of those steps gets automated.
You’ll start by pointing the tool to your clean data source. Once it’s connected, you can start telling it what to do using either natural language or pre-built functions. Your first command might be to group the sales data by month.
For instance, you could instruct Elyx.AI to do the following:
- Summarize Sales by Month: Create a new table that totals the
Amountfor each month using theSaleDatecolumn. - Categorize Product Performance: Within that same monthly summary, count how many times each unique
Productwas sold.
These commands tell the tool exactly how to roll up your granular transaction data into a high-level summary, which is the core of most business reporting.
Adding Transformations and Analysis
A truly useful automated report does more than just add up numbers; it adds context. What if your Region column uses inconsistent abbreviations like "US-E" for the East Coast and "US-W" for the West? No problem. You just add a transformation step to your workflow.
Using a simple function, you can tell Elyx.AI to replace those codes with reader-friendly names like "East Region" and "West Region." This makes the final report instantly understandable to anyone who reads it. You're essentially building your company's business logic right into the automation, ensuring it's applied perfectly every single time.
The real magic here is how robust this is. Once you set that transformation rule, it’s locked in. It will be applied automatically every time the report runs, so you’ll never have to manually fix those region names again. It saves time and kills potential for human error.
Next, let's add a bit more analytical muscle. A common request is a pivot table showing sales broken down by both region and product category. Instead of fussing with the PivotTable Fields pane in Excel, you simply instruct Elyx.AI to generate one from your summarized data, placing regions in the rows and products in the columns. If you're new to this concept, our guide on how to analyze data in Excel is a great place to start.
Finally, you decide what happens with the finished product. You can have the polished report exported as a fresh Excel file, saved as a PDF, or even emailed as an attachment to a specific list of people. This closes the loop, transforming your manual drudgery into a fully automated system that delivers insights without you lifting a finger.
Taking Your Automation to the Next Level
Alright, you've built your first automated workflow. That's a huge step. But now it's time to go beyond basic data processing and turn your reports into a truly intelligent, hands-off system that runs itself.
This is where the real power of Excel reporting automation comes in. It's not just about saving time on a single task; it’s about building a system that delivers crucial insights without you having to lift a finger.
Think about this: a fresh weekly sales summary lands in your inbox every Monday at 9 AM sharp, and you never even had to open the source file. This is exactly what you can do by scheduling your Elyx.AI workflows. Instead of manually running the report, you set it to execute on a recurring schedule—daily, weekly, or monthly—so your stakeholders get consistent, timely information, every time.
From my experience, when you combine scheduling with automated distribution, it’s a total game-changer. You can configure your workflow to not only generate the report but also email it directly to a predefined list of recipients. It completely closes the loop on the entire reporting process.
Making Your Workflows "Think" with Conditional Logic
This is where your automation starts to get really smart. Conditional logic lets your workflow make decisions based on the data it's processing. You’re essentially teaching your report to think for itself by setting up a series of "if-then" rules.
This is incredibly useful for quality control and for zeroing in on what actually matters. Instead of a massive report showing everything, you can create one that just highlights the exceptions.
Here are a few real-world examples:
- Flagging Outliers: Set a rule to highlight any sales transaction over $10,000. This immediately brings high-value deals or potential data entry errors to your attention.
- Filtering by Thresholds: Tell the workflow to only include products with "less than 50 units in stock." Suddenly, you have an instant low-stock report.
- Creating Dynamic Titles: You can even use conditions to change a report's title. Imagine it automatically generating "Q3 Sales Report – GOALS MET" once a certain revenue target is hit.
This kind of intelligence makes your automated reports far more actionable. You shift from just presenting data to actively monitoring the business and getting alerted when something needs your attention.
The real value here is moving from reactive analysis to proactive awareness. Your system doesn't just answer questions you ask; it brings important information to you before you even know to look for it. This is a fundamental shift in how you work with your data.
Chaining Workflows for More Complex Tasks
Some reports are just too complex for a single workflow. You might need to clean a raw data file first, then merge it with a second file from another source, and finally create a summary dashboard from the combined data. Instead of building one massive, tangled workflow, you can chain several smaller, focused ones together.
This approach makes your Excel reporting automation far more modular and much easier to manage. The output of one workflow simply becomes the input for the next, creating a clean, multi-stage data pipeline. This is a standard practice in modern business analytics for a reason.
In fact, the trend is clear: around 60% of companies have implemented some form of automation, with over 90% of workers saying it makes them more productive. For a deeper dive into these numbers, you can find more insights on automation technology adoption at thunderbit.com.
By bringing scheduling, conditional logic, and chained workflows into your toolkit, you transform your Excel reporting from a simple task-doer into a sophisticated system that works for you around the clock.
Keeping Your Automated Reports Running Smoothly
Let’s be real—even the slickest automation isn’t a magic wand you wave once and forget about. Your automated Excel reporting is a powerful asset, but like any well-oiled machine, it needs a little attention to keep performing reliably. Think of it like a new car; it’s fantastic, but you still have to check the oil and get it tuned up to avoid problems down the road.
From my experience, the most common snag you'll hit is a change in your source data. It happens all the time. A colleague in another department decides to rename a column, tweak a date format, or add a new category. To a person, it’s a minor update. To your automation, it’s a show-stopping error that can bring the whole process to a screeching halt.
This is exactly why setting up failure alerts is a non-negotiable step. A tool like Elyx.AI can ping you the moment a workflow doesn't run. That simple notification lets you dive in and fix the problem before your boss even asks where the morning report is.
Stay Ahead of Problems with Good Habits
Fixing things when they break is one thing, but preventing them from breaking in the first place is even better. The single best habit you can build is documenting your automation logic as you go.
I'm not talking about a 50-page technical manual. A simple document or even comments right inside your workflow will do the trick. Just jot down a few key things:
- What's the main goal of this report?
- Where is the data coming from?
- What are the crucial transformation steps? (e.g., "This step converts state abbreviations to full state names.")
This documentation becomes a lifesaver when a teammate needs to cover for you or when you have to revisit the report six months later. It turns your automation from a mysterious "black box" into a transparent and valuable team resource.
Maintaining a clear record of your automation isn’t just good practice; it's a vital part of ensuring business continuity. When processes are well-documented, they become resilient and can outlive any single employee's tenure on a project.
Common Issues and How to Fix Them Fast
When an error does pop up, it usually fits into a handful of common patterns. Knowing what to look for will help you diagnose the issue and get things back on track in minutes, not hours.
Here are a few culprits I see all the time:
| Error Type | What Usually Happened | The Quick Fix |
|---|---|---|
| Data Mismatch | A column header in the source file was renamed. | Jump into your workflow and update the step to use the new column name. |
| Format Inconsistency | Dates suddenly switched from DD/MM/YYYY to MM/DD/YYYY. | Tweak your data cleaning step to handle the new date format. |
| Access Denied | The password for a source database or shared folder was changed. | Simply re-authenticate the connection with the new credentials. |
Ultimately, troubleshooting isn't just about patching the immediate problem; it's about making your entire process more robust. By understanding why an error happened and documenting the fix, you build a stronger, more resilient system over time. A well-maintained automation ensures your reports are not only accurate but also easy to understand, a principle we cover in our guide to data visualization best practices.
Common Questions About Report Automation
Whenever you think about changing a core business process like reporting, questions are going to pop up. It’s only natural. Security, complexity, and what happens when things go wrong are usually top of mind. Let's walk through some of the most common concerns I hear from people who are just starting to explore automating their Excel reports.

Handing over business data to any third-party tool is a big deal, and security should absolutely be your first question. You need to know exactly how your information is being handled.
How Secure Is My Data with an Automation Tool?
Reputable platforms like Elyx.AI are designed with security at their very core. They use end-to-end encryption, which means your data is protected both in transit and while it's stored. These services typically run on major secure cloud platforms like Microsoft Azure or AWS and follow strict international compliance standards like SOC 2 and GDPR.
My advice? Before you commit to any tool, make it a non-negotiable step to review their security and compliance documentation. This is how you verify your sensitive business data gets the protection it needs, and it's what will let you sleep at night.
Can I Automate Reports from Multiple Data Sources?
Yes, and honestly, this is where automation really shines. Think about how much time you've wasted manually copying and pasting data from different files. A well-designed automation workflow completely eliminates that headache.
With a tool like Elyx.AI, you can set up a single process that pulls information from all over the place:
- Multiple Excel files scattered across different folders
- CSVs you've downloaded from other software
- Even direct connections to databases or cloud apps
The system can then pull all of it together, clean it up, and process it into one cohesive report. This feature alone is often the biggest time-saver, easily reclaiming hours of tedious work every single month.
The real power of automation lies in bringing scattered data together. It turns a mess of separate files into a single source of truth, giving you a clear view of what’s actually happening in your business so you can make faster, smarter decisions.
What Happens If My Source Data Format Changes?
This is a great question because it happens all the time. Someone renames a column, changes a date format, and suddenly, everything breaks. A solid Excel reporting automation setup has to account for this.
The best practice is to build error handling right into your workflow. You should configure notifications to get an immediate alert if a process fails. That way, if a source file changes, you know about it instantly instead of finding out days later.
A little proactive maintenance goes a long way here. Periodically check that your data sources haven't changed and that your automation logic still makes sense. This approach turns a potential fire drill into a simple, manageable fix.
Ready to stop wrestling with manual reports and start building a smarter, automated system? Discover how Elyx.AI can transform your Excel workflows. Try Elyx.AI today and reclaim your time.
Reading Excel tutorials to save time?
What if an AI did the work for you?
Describe what you need, Elyx executes it in Excel.
Sign up