Master Data Transformation in Excel with Easy Tips

So, what exactly is data transformation? Think of it as the art of turning raw, messy data into a clean, structured, and genuinely useful format right inside Excel. It’s all about tackling the common headaches—like removing duplicates, standardizing text, splitting columns, and fixing errors—to make sure your data is solid enough to base decisions on.
Why Data Transformation in Excel Is Still a Core Skill
Let's be honest, data rarely shows up in a neat little package, ready for analysis. More often than not, it's a jumble of inconsistent formats, pesky hidden spaces, and mixed-up text that's practically useless as is.
Imagine pulling a monthly sales report where one person entered "USA," another typed "United States," and a third put "U.S.A." If you try to build a report from that, your numbers will be completely off. This is where mastering data transformation in Excel becomes a non-negotiable skill. It’s how you turn that chaos into a single source of truth.
Spending too much time on Excel?
Elyx AI generates your formulas and automates your tasks in seconds.
Sign up →This isn’t just about making your spreadsheets look pretty. It's the critical first step that ensures everything that comes next—from a simple chart to a complex pivot table—is actually accurate and meaningful. It’s about safeguarding the integrity of your information.
From Messy Data to Actionable Insights
When you know how to handle data properly, you can perform powerful analysis without needing to beg for a budget for expensive, specialized software. Instead of spending hours manually fixing the same mistakes month after month, you can create repeatable processes that save you and your team a ton of time. This skill directly connects raw numbers to the clear, actionable insights that help a business grow.
You've probably run into these common data messes before:
- Inconsistent Date Formats: Trying to make sense of "12-05-2024," "May 12, 2024," and "2024/05/12" all in the same column.
- Jumbled Text Data: Needing to split a "FullName" column into separate "First Name" and "Last Name" columns for better customer segmentation.
- Leading/Trailing Spaces: Those invisible extra spaces that throw off your VLOOKUPs and sorting.
- Mixed Data Types: A column of numbers formatted as text (like "1,200") that you can't actually use in any calculations.
The ability to clean and structure data isn't some niche IT skill anymore—it's a core business competency. It’s the bridge between just having data and actually using it to make smarter, faster decisions.
This need for data-savvy professionals is a huge trend. The digital transformation market, which leans heavily on tools like Excel, was valued at a whopping USD 880.28 billion in 2023 and is only getting bigger. Yet, so many companies are still struggling to get a handle on their data, which highlights a massive opportunity for people with strong Excel skills. You can explore more data transformation market insights to see just how big this is.
By learning these techniques, you're not just tidying up cells. You’re building the reliable foundation for your entire analytics strategy.
To give you a clearer picture, here’s a quick rundown of common data problems you'll encounter and the go-to Excel tools for fixing them.
Common Data Problems and Their Excel Solutions
| Data Problem | Example | Primary Excel Tool |
|---|---|---|
| Inconsistent Text | "USA", "U.S.", "United States" | FIND & REPLACE, Power Query |
| Extra Spaces | " Product A " | TRIM() formula, Power Query |
| Incorrect Case | "john smith", "JOHN SMITH" | PROPER(), UPPER(), LOWER() formulas |
| Combined Text | "Smith,John" | Text to Columns, Flash Fill |
| Mixed Data Types | Numbers stored as text | VALUE() formula, Format Cells |
| Duplicate Records | Identical rows of data | Remove Duplicates, Power Query |
This table is just a starting point, but it shows how Excel provides a powerful toolkit right out of the box for handling the most frequent data quality issues. Knowing which tool to grab for which problem is half the battle.
Automating Workflows with Power Query
While formulas are great for a quick fix on a single spreadsheet, Power Query is the engine you need for serious, repeatable data transformation in Excel. Honestly, it's like having an automated assistant who handles the tedious, soul-crushing parts of data prep. It works behind the scenes to clean and reshape data in ways that would take hours of painstaking manual work. The best part? It's already built right into modern versions of Excel.
What makes it so indispensable is that it records every single step you take. This creates a repeatable "recipe" or query that you can run again with a single click. Think about those messy monthly sales reports you get. With Power Query, you set up the cleanup process just once. From then on, every time new data comes in, you just hit refresh, and it's done.
A Practical Scenario: Combining Regional Sales Data
Let's imagine a classic business headache. You get three separate Excel files every month from your North, South, and West regional offices. The data is a total mess—column names don't match, there are random blank rows, and customer names are all crammed into a single column. Trying to combine and clean this manually is an absolute nightmare.
This is where Power Query shines. You can point it directly to the folder containing these files, and it will automatically consolidate them into one table. From there, you're taken to the Power Query Editor, which is basically your command center for all things data transformation.
You can then start applying a series of cleanup steps, all with simple button clicks:
- Remove Unnecessary Columns: Get rid of clutter like "Internal Notes" or "Employee ID" that won't be part of your final analysis.
- Filter Out Blank Rows: Instantly delete those empty rows that plague exported data and throw off your calculations.
- Split Columns: Take that messy "Full Name" column and easily split it into "First Name" and "Last Name" using a space or comma as the separator.
- Standardize Text Case: Fix inconsistent entries like "jane doe" and "JANE DOE" by applying the "Capitalize Each Word" transformation, making everything a clean "Jane Doe."
The whole process is visual. You aren't writing a single complex formula; you're just clicking through a user-friendly interface.
This infographic really captures the flow of turning raw, messy data into something structured and ready for analysis.
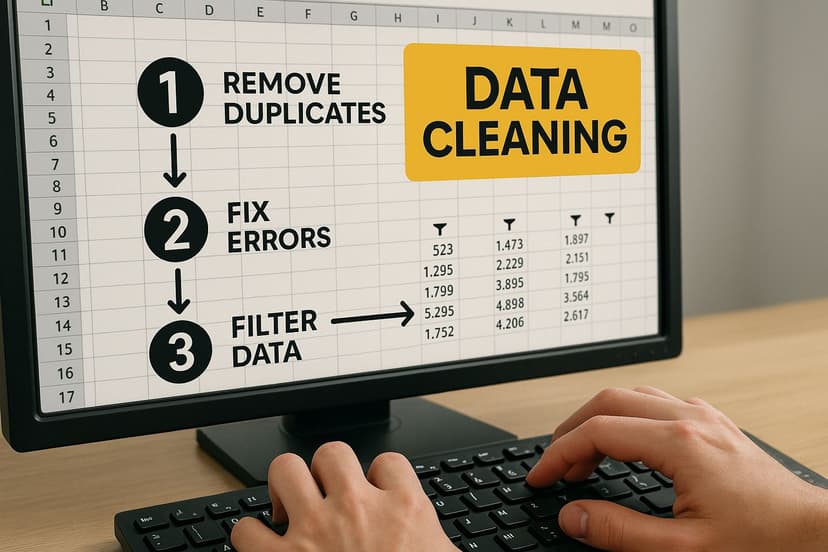
As you can see, a streamlined data cleaning process is the essential bridge between chaotic raw data and clear, reliable insights.
Advanced Transformations Made Simple
Power Query's toolkit goes way beyond basic cleaning. One of its most powerful features is the ability to Unpivot Columns. Let's say your sales data is in a "wide" format, with months like Jan, Feb, and Mar each having their own column. This structure is a real pain for analysis. The unpivot feature flips this on its side, transforming it into a "tall" format with just two new columns: one for the attribute (Month) and one for the value (Sales). This is the perfect layout for building pivot tables and charts.
Power Query is more than a tool; it's a shift in mindset. It moves you from being a manual data janitor to an architect of automated data workflows, guaranteeing consistency and saving immense amounts of time.
This evolution is at the heart of modern Excel. The integration of tools like Power Query has dramatically expanded Excel’s capacity for handling complex data, giving it robust Extract, Transform, Load (ETL) capabilities right out of the box. You can merge columns, remove duplicates, and pivot data without ever leaving your spreadsheet.
Once you’ve applied all your transformations, you just hit "Close & Load." Power Query sends the clean, structured data into a new worksheet or, for larger datasets, directly into Excel's Data Model. The next time you get new sales files, you just drop them in your source folder and click "Refresh All." The entire process runs in seconds. This level of automation ensures consistency and frees you up to focus on what actually matters—getting insights from your data.
Once your data is transformed and sparkling clean, the next step is analysis. If you're ready to dive in, you might want to explore our detailed guide on how to analyze data in Excel.
Using Formulas for Quick Data Cleaning
While Power Query is the undisputed champ for heavy-duty, repeatable tasks, sometimes you just need a quick, surgical fix. This is where classic Excel formulas really come into their own. They're perfect for those fast, on-the-fly data transformation in Excel tasks where launching a full query would be total overkill.
I like to think of it as the difference between renovating a whole kitchen (that's Power Query) and just sharpening your favorite chef's knife (that's a formula). Both are essential skills, but you have to pick the right tool for the job. When you're staring at a one-off list that needs a bit of tidying before you can send it off, formulas are your best friend.
Maybe you just pasted a column of product names from a website, and it's a mess of inconsistent spacing and weird capitalization. A full Power Query workflow for something that simple? No, thank you.
Essential Formulas for Text Cleanup
Let's walk through a few of my go-to functions that solve common data messes in seconds. Picture a cell, say A2, containing the text " JOHN smith ". It's a classic case of extra spaces and all-over-the-place capitalization.
Here's how we fix it:
- TRIM: This is always my first line of defense against pesky extra spaces. The formula
=TRIM(A2)instantly strips out leading and trailing spaces, plus any double spaces between words. Just like that, you get"JOHN smith". - PROPER, UPPER, and LOWER: With the spaces gone, we can tackle the capitalization.
=PROPER(A2)is perfect for names, converting the text to"John Smith". If you needed all caps, you'd useUPPERfor"JOHN SMITH", orLOWERfor"john smith". - Combining Formulas: Now for the real magic. You can nest these functions to get everything done at once. The formula
=PROPER(TRIM(A2))cleans both the spacing and the capitalization in a single, elegant step, leaving you with a perfect"John Smith".
These simple text functions are often the absolute fastest way to bring consistency to a dataset. Never underestimate their power for quick cleanups—they can save you from endless manual edits and ensure your VLOOKUPs or pivot tables actually work.
Splitting and Merging Data
Another task I see all the time is data that's either stuck together when it should be separate, or vice-versa.
For instance, you might have a cell with "Doe,John". The modern TEXTSPLIT function is a game-changer here. Just type =TEXTSPLIT(A2, ","), and Excel will automatically spill "Doe" and "John" into two separate cells to the right. It’s a massive improvement over the clunky, old Text to Columns wizard for most situations.
On the flip side, if you have "John" in A2 and "Doe" in B2, you can merge them with the CONCAT function or the ampersand (&) operator. Either =CONCAT(A2, " ", B2) or =A2 & " " & B2 will give you "John Doe". Personally, I find the ampersand is often quicker for these simple joins.
These functions are fantastic for a tactical approach. For a more comprehensive look, check out our guide on how to clean data in Excel, which covers even more methods. Knowing when to use a quick formula versus a more robust tool like Power Query is a crucial skill for any efficient data pro.
Reshaping Your Data for Analysis with Pivot Tables
Once your data is clean and consistent, the real fun begins. Transformation isn't just about tidying up; it's about reshaping your dataset to uncover the stories hidden within the numbers. This is where you move from data janitor to data analyst, and your best friend in this final step is the Pivot Table.
Think of a Pivot Table as your command center for analysis. It takes your perfectly prepped data and lets you slice, dice, and summarize it in countless ways. With just a few clicks, you can condense thousands of rows into a clear, actionable summary, bridging the gap between raw data and genuine business intelligence.

From Clean Data to Clear Insights
Let's go back to our sales data. Now that we have clean columns for Region, Sales Amount, and Order Date, we can finally ask the big questions. Instead of wrestling with filters and manual calculations, a Pivot Table does all the heavy lifting.
Getting started is simple: just select your data range and choose to insert a Pivot Table. The magic happens in the PivotTable Fields pane, where you literally drag and drop your columns to build a report.
- Rows: Drag the "Region" field here. Instantly, you get a unique list of every sales region.
- Columns: Pop the "Order Date" field here. Excel is smart enough to group dates into years and quarters automatically, which is fantastic for spotting trends over time.
- Values: Drop "Sales Amount" into this box. It defaults to a
SUM, giving you the total revenue for each region, broken down by quarter.
In less than a minute, you've turned a flat list of transactions into a powerful, multi-dimensional summary. You can immediately spot your top-performing regions or see which quarter had a sales dip. For a more detailed guide, check out our post on creating Pivot Tables in Excel.
Go Deeper with Custom Metrics
Pivot Tables are much more than simple summaries. Their real power comes from the advanced features that let you build a fully interactive dashboard without ever touching another formula.
One of my favorite tools is Calculated Fields. Let's say you need to calculate a 7.5% sales tax for each region. Instead of messing with your original dataset by adding another column, you can create a calculated field right inside the Pivot Table. Just use the formula = 'Sales Amount' * 0.075. This keeps your analysis neat and your source data pristine.
Another game-changer is Slicers. These are user-friendly, clickable buttons that filter your entire Pivot Table report. Add a slicer for "Product Category" or "Sales Rep," and anyone—even a non-Excel user—can easily explore the data and find their own insights.
Applying AI for Smarter Data Transformation
Alright, let's talk about the next step up from traditional methods. Power Query and formulas are the workhorses of data cleaning in Excel, no doubt about it. But when you hit a wall with a particularly messy dataset, or you just can't remember that one obscure function, AI tools are changing the game. This is where you stop hunting through function libraries and start just asking your spreadsheet for what you want.
AI-powered add-ins like Elyx.AI essentially embed a data specialist right into your worksheet. Instead of you needing to know the exact syntax for a nested IF statement or the right steps in the Power Query editor, you can use plain English. This shift massively opens up what's possible for people who aren't full-time data analysts.
Using Natural Language for Complex Tasks
Think about this common headache: you have a column of jumbled product descriptions, and your only goal is to pull out the product names. If you've ever tried this manually, you know it can be a nightmare of LEFT, RIGHT, FIND, and LEN functions that breaks the second it hits an unexpected variation.
With an AI tool, your process looks completely different. You just select the column and type a prompt like: "Extract the product names from column C." The AI will look for the patterns in the text—even the inconsistent ones—and generate a clean list for you.
Here are a few other real-world situations where this approach is a lifesaver:
- Standardizing Addresses: Messy address data is a classic problem. Instead of writing complex parsing rules, you can just ask, "Format the addresses in column D into a standard City, State, ZIP format."
- Sentiment Analysis: Imagine you have a column of raw customer feedback. A simple prompt like, "Analyze the sentiment in column F and label each entry as Positive, Negative, or Neutral," can save you hours of manual reading.
- Generating Complex Formulas: We've all been there—stuck trying to build a tricky formula. You can describe your goal in plain language, like, "Create a formula that calculates a 5% bonus for salespeople who exceeded their quarterly target," and the AI will build it on the spot.
This conversational style isn't just a gimmick; it’s about pure efficiency. Data pros spend a huge chunk of their time just getting data ready for analysis. AI assistants can seriously slash that prep time.
Beyond Prompts: AI as a Data Partner
The best AI tools don't just stop at one-off commands. They act more like a partner you can have a conversation with. For instance, integrated chat features let you refine your results with follow-up questions. You can clean some data, then ask the AI for advice on the best way to visualize it, or even ask for step-by-step instructions on how to fix a #VALUE! error.
The real magic of AI in Excel is its ability to handle ambiguity. It understands context and intent from your words, letting it solve problems that rigid, rule-based formulas simply can't touch.
This is especially true when you're dealing with unstructured text, where the data has no predictable format. While broad tools like Microsoft's own Copilot are bringing AI into the Office suite, specialized add-ins are often fine-tuned specifically for these kinds of data transformation and analysis workflows.
Ultimately, this means you spend less time fighting with the software and more time actually finding the story your data is trying to tell. This new way of working makes advanced data transformation in Excel something anyone can do.
Got Questions About Transforming Data in Excel? We’ve Got Answers.
Even with the best tools at your fingertips, you're bound to run into questions when you're deep in a data transformation project. It happens to everyone. Let's walk through a couple of the most common head-scratchers I hear all the time. Getting the 'why' behind each choice is just as crucial as knowing the 'how'.
A big one is always about which tool to grab for the job. Do you stick with a quick formula, or is it time to fire up the Power Query editor? Honestly, the answer almost always hinges on two things: the scale of your data and how often you'll be doing the task.
When Should I Use Power Query Instead of Formulas?
Think of formulas as your go-to for surgical strikes. Got a single column that needs a quick cleanup? Need to make a small, one-time adjustment that you won't have to do again? Formulas like TRIM or PROPER are perfect for that. They’re fast, effective, and right there on the worksheet for those immediate fixes.
But when the job gets bigger, you need a bigger tool. Power Query is your heavy machinery, built for tasks that are large, repetitive, and complex.
Here’s my rule of thumb:
- Massive Datasets: If you're staring down thousands (or hundreds of thousands) of rows, Power Query’s engine will run circles around standard worksheet formulas. It's just built to be more efficient.
- Repetitive Work: Do you get the same ugly report every single Monday morning? If you need to repeat a cleaning process weekly or monthly, building it once in Power Query saves you countless hours. Just hit "Refresh," and you're done.
- Multiple Sources: Trying to stitch together data from three different CSV files and a SharePoint list? That's Power Query’s bread and butter. Attempting that with formulas is a recipe for a headache.
The single biggest mistake I see people make is manually changing their original data file. It's a disaster waiting to happen. It's risky, you can't trace your steps, and your raw data is gone forever. Always, always work on a copy or—even better—use a non-destructive tool like Power Query that leaves your source files pristine.
Can Excel Really Handle Millions of Rows of Data?
The short answer is a surprising yes—but with a catch. You can't just paste millions of rows into a standard Excel worksheet. The grid itself tops out at 1,048,576 rows.
So, how do you work around that? This is where Excel's Data Model becomes your secret weapon.
Using Power Query, you can connect to massive data sources (like a SQL database or huge text files) and do all your cleaning and transforming. Then, instead of loading the results to a worksheet, you load them directly into the Data Model. This powerhouse engine, which also drives Power Pivot, completely bypasses the worksheet’s row limit. It lets you analyze millions—even tens of millions—of rows right inside Excel because the heavy lifting happens in the background, not in the cells.
Ready to stop wrestling with complex formulas and repetitive cleaning tasks? Elyx.AI integrates directly into your worksheet, allowing you to clean, transform, and analyze your data using simple, natural language prompts. Discover how Elyx.AI can revolutionize your Excel workflow today.
Reading Excel tutorials to save time?
What if an AI did the work for you?
Describe what you need, Elyx executes it in Excel.
Sign up