Your Guide to Data Mining in Excel

Of course you can. It's a common misconception that Excel is just for simple lists and basic calculations. The reality is, modern Excel is a surprisingly robust tool for data mining. You can absolutely use it to dig into your data, spot hidden patterns, and even start predicting future trends—all without leaving the familiar comfort of a spreadsheet.
Why Bother with Data Mining in Excel?

Think about it: most businesses are already swimming in data stored in Excel files. Customer lists, daily sales figures, operational logs—it's all there. The real challenge isn't collecting data; it's figuring out what it all means. This is precisely where data mining skills come into play. It turns Excel from a simple data repository into a strategic asset for making smarter decisions.
Spending too much time on Excel?
Elyx AI generates your formulas and automates your tasks in seconds.
Sign up →This isn't just a niche skill anymore. The global market for data mining and modeling is already worth a staggering $25 billion and is expected to grow by 15% each year through 2033. This explosion in growth shows just how much businesses in every industry are relying on accessible tools like Excel’s own Power Query and PivotTables. You can read more about this market expansion on Data Insights Market.
The Basic Ideas, Explained Simply
At its core, data mining is all about looking at your data from different angles to find useful information. Two of the most common techniques you’ll come across are classification and regression.
-
Classification is really just about sorting. Imagine a retail business categorizing its customers as "High-Spenders," "Occasional Shoppers," or "At-Risk" based on their buying habits. That's classification in action.
-
Regression is about predicting a number. A financial analyst might use regression to forecast next quarter's revenue by looking at past sales data and how much was spent on marketing.
The Bottom Line: You don't need a Ph.D. in data science to start using these methods. Excel gives you everything you need to perform both classification and regression with tools you probably already have installed.
How This Works in the Real World
The true value of data mining in Excel becomes crystal clear when you apply it to actual business problems. This isn't just a theoretical exercise; it’s about getting answers that can directly improve your business.
Let’s look at a few examples:
- Healthcare: A clinic could analyze patient records to identify common risk factors for certain diseases, leading to better preventative care programs.
- Finance: Analysts can sift through market data to flag potentially fraudulent transactions or predict how a stock might perform.
- Retail: A store manager can analyze sales data to figure out which products are often bought together, helping them optimize store layout and promotions.
When you learn these techniques, you're doing more than just crunching numbers. You're building a system to answer your most pressing business questions. This guide will walk you through exactly how to turn your raw spreadsheet data into the kind of insights that drive real growth.
Getting Your Data Ready for Analysis

There’s an old saying that every data analyst knows by heart: "garbage in, garbage out." It’s the absolute truth. Before you can even dream of uncovering brilliant insights, your first job is to roll up your sleeves and get your data in order. This isn't the glamorous part of data mining, but skipping it is the fastest way to get flawed results.
Think of it like being a chef. You can't create a masterpiece with dirty vegetables or mismatched ingredients. Raw data, especially from real-world sources like sales exports or customer lists, is almost always messy. It’s full of inconsistencies, typos, and formatting quirks that can trip up even the most powerful analytical tools.
This prep work is more than just deleting a few bad rows. It's about methodically shaping your raw information into a clean, structured format that Excel can actually work with.
Fixing Common Data Problems
Most raw datasets are plagued by a few common issues. If you don't fix them, they'll quietly sabotage your analysis down the line. Luckily, Excel gives us some simple tools to handle them.
Let's say you're working with a typical customer sales file. Here are the usual suspects you'll find:
- Extra Spaces: A customer named " John Smith " (with spaces at the beginning or end) is not the same as "John Smith" to Excel. The
TRIMfunction is perfect for this—it zaps those extra spaces instantly. - Inconsistent Casing: You might find "new york," "New York," and "NEW YORK" all in the same column. To your analysis, those are three separate cities. Use the
PROPERfunction to standardize them all to "New York" for clean, reliable grouping. - Duplicate Entries: It happens all the time. The same order or customer gets entered twice. The Remove Duplicates tool, found right on the Data tab, is your one-click fix.
Here's a piece of advice that has saved me more times than I can count: Always work on a copy of your original data. Make it a non-negotiable habit. If a formula goes wrong or you delete the wrong thing, you can always go back to the untouched source file.
Shaping Data for Deeper Insights
Once the data is clean, the next step is to transform it. This is where you start to really prepare your dataset for mining, often by changing its structure to reveal new angles for analysis.
For example, you might need to convert a column of text that just looks like dates (like "2024-05-20") into an actual date format. Once you do, Excel can perform time-based calculations, like finding monthly trends.
Another powerful technique is creating new calculated columns. Imagine you have columns for 'Unit Price' and 'Quantity Sold.' You can easily create a new 'Total Revenue' column by multiplying the two. This metric wasn't in your original dataset, but it’s probably one of the most important things you'll want to analyze.
For a deeper dive into these fundamentals, check out our guide on how to analyze data in Excel.
This process of cleaning and transforming might feel like a chore, but it's the most critical part of the entire data mining journey. It builds the foundation for everything that follows.
Once your data is cleaned up and organized, the real fun begins: exploratory analysis. This is precisely where PivotTables come into their own. Honestly, they are the single most powerful tool for data mining in Excel if you want to avoid writing complex formulas. They let you slice, dice, and make sense of massive datasets with just a few clicks.
Think about it. You've got a sales spreadsheet with thousands of rows and columns for 'Date', 'Product', 'Region', and 'Sales Amount'. Staring at that raw data is like looking at static on a TV screen—it's just noise. A PivotTable cuts through that noise and turns it into a clear signal, helping you instantly answer critical business questions like which products are flying off the shelves or which regions are falling behind.
From Raw Data to Actionable Reports
Getting a PivotTable up and running is surprisingly simple. Just select your data range, head over to the 'Insert' tab, and click 'PivotTable'. A field list will pop up, letting you drag your columns into four different areas: Filters, Columns, Rows, and Values.
This drag-and-drop system is what makes them so approachable. Wondering about total sales by region? Just drag the 'Region' field to the Rows area and 'Sales Amount' to the Values area. Bam. Excel instantly sums up the sales for each region.
But the true magic happens when you start layering on more complexity.
- Grouping Data: If you have daily sales data, you can right-click the date field in your PivotTable and group it by month or quarter. This is a fantastic way to spot seasonal trends without any extra work.
- Changing Calculations: By default, PivotTables will sum your numbers. But with a quick right-click, you can change the calculation to count, average, or even show a value as a percentage of the grand total. This is perfect for things like figuring out market share or seeing how much a single product contributes to overall sales.
- Calculated Fields: What if you need a metric that isn't in your original dataset, like 'Profit Margin'? The 'Calculated Field' feature lets you build custom formulas right inside the PivotTable. This keeps your source data untouched and clean.
A personal tip I always share for making PivotTables easier to read: switch to the 'Tabular Form' layout. You'll find it in the 'Design' tab under 'Report Layout'. It transforms the report from a compressed summary into a clean, well-organized table that's much easier on the eyes.
To help you decide which tool is right for the job, here’s a quick comparison of the native options within Excel.
Comparing Excel Data Mining Tools
| Technique | Primary Use Case | Complexity Level | Best For |
|---|---|---|---|
| PivotTables | Summarizing, aggregating, and exploring large datasets interactively. | Low | Quickly summarizing sales by region, analyzing customer segments, or tracking performance metrics without formulas. |
| Power Query | Extracting, transforming, and loading (ETL) data from multiple sources. | Medium | Cleaning messy data, merging tables from different files, and automating data preparation before analysis. |
| Formulas (e.g., VLOOKUP, SUMIFS) | Performing specific, targeted calculations and lookups within a static table. | Low to High | Pulling specific data points from one table to another, conditional summing, or creating calculated columns. |
Each of these tools has its place. Formulas are great for surgical strikes, Power Query is your go-to for heavy-duty cleaning, and PivotTables are the undisputed champion for rapid, exploratory analysis.
Making Your Analysis Interactive with Slicers
Slicers are the final touch that elevates a static report into a genuinely interactive dashboard. Instead of fumbling with filter dropdowns in your PivotTable, you can add slicers—which are basically sleek, clickable buttons—for fields like 'Region' or 'Product Category'.
When you click a button on the slicer, the connected PivotTable instantly filters to show only the data for that selection. The best part? You can link a single slicer to multiple PivotTables. This is how you build a dynamic dashboard where everything updates with a single click, empowering colleagues to explore the data and find their own insights without needing to understand how a PivotTable works.
For a complete walkthrough on getting started, our detailed guide on creating PivotTables in Excel covers all the essentials. Getting comfortable with PivotTables is a non-negotiable step in your data mining journey; it gives you the power to quickly test ideas and uncover the stories hidden in your spreadsheets.
Getting Your Data Ready for Analysis with Power Query
If you think of PivotTables as the way you explore your data, then Power Query is the behind-the-scenes powerhouse that gets everything in order first. For anyone serious about data mining in Excel, this is an absolute must-know tool. It’s designed to tackle the most time-consuming and frankly, tedious part of any analysis: preparing the data.
What makes Power Query so special is that it remembers every step you take. When you clean a messy column, merge a few files together, or filter out irrelevant rows, it's all recorded as a repeatable script. So, when next month’s data comes in, you don’t have to do it all over again. You just hit “Refresh.” This saves a massive amount of time and, more importantly, keeps your process consistent and error-free.
Effective data mining always starts with squeaky-clean data, and that’s exactly where Power Query shines.
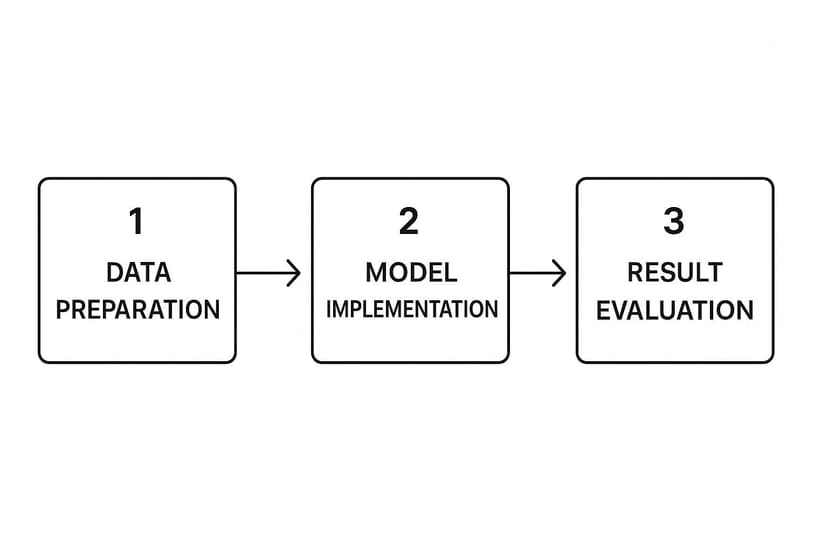
As you can see, the whole process hinges on solid data preparation. Before you can even think about building models or finding insights, your data needs to be in the right shape.
Tapping into Your Data Sources
One of the best things about Power Query is how it can connect to just about anything. You aren't stuck with just the data in your current spreadsheet. Instead, you can pull information directly from a huge range of sources:
- Other Excel workbooks
- Simple CSV or text files
- An entire folder filled with files (a real game-changer!)
- Databases like SQL Server or even web pages
Once you've connected to a source, you land in the Power Query Editor. This is where the real work happens. It's an intuitive space where you can perform complex transformations that would be incredibly frustrating to do with traditional Excel formulas.
My Two Cents: Think of Power Query as a recipe you create once. The goal is to build a perfect, analysis-ready master table. After you build that query (your recipe), you can apply it to new data with a single click. It's a true set-it-and-forget-it asset.
Real-World Example: Merging Monthly Sales Files
Let's walk through a common scenario. Say your company keeps its sales data in separate monthly files for the East, West, and North regions. They all get dumped into the same folder. The old-school way would be to manually open each file and copy-paste everything into one giant master sheet. It’s boring, and you just know someone’s going to make a mistake eventually.
This is where Power Query feels like magic. You just point it to the folder.
It will automatically:
- Open every file inside.
- Stack them all on top of each other.
- Combine them into one clean, unified table.
From there, you can apply your cleaning steps to the whole dataset at once—like getting rid of extra columns or making sure "N. Region" and "North" are standardized.
The demand for this kind of automation is a big reason the data mining tools market is growing so fast. It's expected to jump from $1.16 billion to $1.31 billion and could hit $2.13 billion by 2029. You can see more on this trend from The Business Research Company.
Getting these transformations right is foundational to good analysis. If you want to go deeper into shaping your datasets, we have a complete guide on data transformation in Excel. Once you get the hang of it in Power Query, you'll wonder how you ever managed without it.
Adding AI for Predictive Analytics in Excel

While native Excel tools like PivotTables and Power Query are workhorses for data analysis, bringing artificial intelligence into the mix opens up a whole new world. This is where you can truly elevate your data mining in Excel. AI add-ins, such as Elyx.AI, essentially build a bridge from your familiar spreadsheet to the world of data science, letting you run some seriously advanced analysis without ever writing a line of code.
Think of it less as replacing your skills and more as supercharging them. AI helps you spot the subtle, deeper patterns that standard analysis often can't see. Suddenly, you're not just looking at what has happened; you're starting to predict what will happen. It’s a genuine shift from descriptive reports to predictive insights, all from the comfort of your worksheet.
The rise of cloud computing has made these powerful capabilities much more accessible. Professionals can now tap into massive datasets and sophisticated analytical models on demand. Just look at the European Union, where enterprise adoption of cloud services climbed by 4.2 percentage points between 2021 and 2023, reaching 45.2%. This isn't just a tech trend; it shows how cloud-powered tools are helping people get more mileage out of programs they already know, like Excel. You can find more on the data mining tools market to see just how big this is getting.
Performing Sentiment Analysis on Customer Feedback
A perfect, real-world example of AI in Excel is sentiment analysis. Let's say you're sitting on a spreadsheet with thousands of rows of customer comments from recent surveys. Trying to read and categorize every single one by hand would be a nightmare—we're talking days of tedious work.
This is where an AI add-in completely changes the game. You just have to tell the tool which column holds the text feedback.
From there, the AI takes over. It will:
- Scan and interpret the meaning behind each comment.
- Tag each one as Positive, Negative, or Neutral.
- Populate a brand-new column in your table with these handy labels.
In an instant, all that messy, unstructured feedback becomes clean, quantifiable data. Now, you can spin up a PivotTable to get immediate answers to questions like, "What's the ratio of negative to positive feedback?" or "Are customers in the Midwest getting happier this quarter?"
Key Takeaway: AI makes text analysis practical for anyone with a spreadsheet. You no longer need to be a coding guru to make sense of customer reviews, support tickets, or open-ended survey answers.
Building Predictive Forecasts with AI
Predictive forecasting is another area where AI brings some serious firepower. Excel's built-in forecast sheet is decent for simple trends, but AI-driven models can deliver far more accurate and sophisticated predictions because they can juggle multiple variables at once.
For instance, imagine trying to forecast next quarter's sales. Instead of just looking at past sales, you could build a model that also considers your marketing budget, seasonal buying patterns, and even broader economic indicators. The AI model figures out the complex interplay between all these factors to produce a forecast you can actually trust. You're moving way beyond simple trend lines and into machine learning-driven predictions, which can give you a real strategic edge.
Answering Your Top Questions About Data Mining in Excel
When you're just getting started with data mining in Excel, a few questions almost always pop up. Let's get those out of the way, because once you have these answers, you'll find the whole process a lot less intimidating and much more rewarding.
Is Data Mining Just Another Name for Data Analysis?
Not quite. People throw these terms around interchangeably all the time, but there's a real difference in what you’re trying to accomplish.
Think of it like this: data analysis is about looking in the rearview mirror. You're summarizing what’s already happened. A classic example is building a PivotTable to see last quarter's sales totals by region. You're explaining the past.
Data mining, however, is about looking through the windshield to see what’s ahead. You're trying to predict future outcomes or uncover hidden patterns you wouldn't spot otherwise. Using that same sales data to forecast next month's numbers or to group customers into new segments based on their buying behavior—that's data mining.
Excel can do both, but true data mining often pulls in tools like the Analysis ToolPak or specialized AI add-ins to find those predictive insights.
Can Excel Actually Handle Big Datasets?
This is a huge—and totally valid—concern. We've all heard about Excel's 1,048,576 row limit per worksheet, which can sound pretty small these days. But modern Excel has some serious muscle under the hood.
The game-changers are Power Query and Power Pivot. These tools were built to solve the big data problem. They use a powerful compression engine to manage your data in memory, letting you work with millions—sometimes even tens of millions—of rows without bringing your computer to a grinding halt.
My Personal Take: I’ve used Power Pivot to analyze datasets with over 5 million rows on a standard company laptop without a problem. The trick is to keep the raw data out of the worksheet grid and let Power Query and Power Pivot handle the heavy lifting behind the scenes.
While you'll want a dedicated database for hundreds of millions of rows, you’d be amazed at what Excel can handle for most real-world business scenarios.
Do I Really Need to Learn How to Code?
Nope, and that's one of the best things about using Excel for this. You can get incredibly sophisticated with your analysis without writing a single line of code.
Power Query, for instance, has a beautiful point-and-click interface. Every time you click a button to "Remove Columns" or "Merge Queries," it's writing the necessary M code for you in the background. PivotTables are just as intuitive, relying on a simple drag-and-drop system to build complex summaries. Even the more advanced statistical functions and AI add-ins are designed with user-friendly menus, putting powerful techniques in everyone's hands.
What Are the Must-Know Excel Functions?
While tools handle the big stuff, a handful of core functions are still your bread and butter for day-to-day data work. I use these constantly.
- XLOOKUP (and its older cousin, VLOOKUP): Absolutely essential for merging datasets by pulling matching information from one table into another.
- SUMIFS / COUNTIFS: The best way to calculate totals or counts that depend on multiple conditions. So much more flexible than their singular counterparts.
- IF / IFS: Your go-to for creating new categories or flags based on logical rules, like labeling sales as 'High' or 'Low' based on a threshold.
- Text Functions (TRIM, CLEAN, LEFT, FIND): A lifesaver for cleaning up messy text data. You can't analyze data properly if it's not standardized first.
Ready to move beyond manual formulas and unlock predictive insights right inside your spreadsheet? Elyx.AI integrates directly into Excel, giving you the power to run sentiment analysis, generate forecasts, and get instant answers from your data using simple prompts. Stop wrestling with complex functions and start making smarter, faster decisions.
See how Elyx.AI can add AI-powered analysis to your workflow and change the way you work with data.
Reading Excel tutorials to save time?
What if an AI did the work for you?
Describe what you need, Elyx executes it in Excel.
Sign up