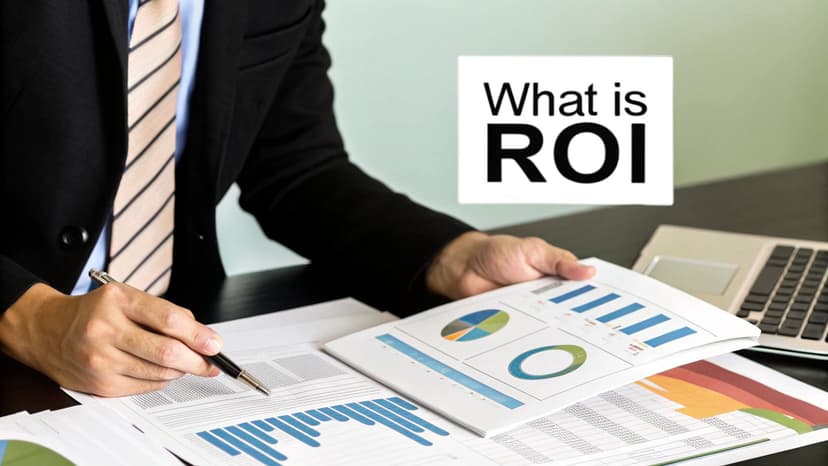
How to Calculate ROI to Prove Investment Value

At its core, calculating return on investment is pretty simple. You just take the net profit you made from an investment, divide it by what you originally spent, and then multiply that by 100 to get a percentage. This simple but powerful ratio is what we call Return on Investment (ROI), and it's the gold standard for figuring out how profitable any venture really is.
Your Quick Guide to Calculating Return on Investment
Before you get lost in complex spreadsheets or fancy software, it’s crucial to really get the core idea behind ROI. It’s nothing more than a straightforward comparison: what did you get back versus what did you put in?
Spending too much time on Excel?
Elyx AI generates your formulas and automates your tasks in seconds.
Sign up →This single percentage is your key to making smarter decisions. Are you evaluating a new marketing campaign, thinking about buying new equipment, or weighing a stock purchase? ROI gives you a clear answer.
Grasping this fundamental formula is the first real step. It turns vague business goals into hard numbers that actually mean something to stakeholders and leadership.
Breaking Down the ROI Formula Components
To really get a handle on ROI, it helps to break down the formula into its core parts. Think of it as a quick reference guide to what each piece of the puzzle means.
| Component | What It Means | Example |
|---|---|---|
| Net Return on Investment | This is your total profit after you subtract the initial cost. It’s what you actually gained. | You sell a stock for $15,000 that you bought for $10,000. Your net return is $5,000. |
| Cost of Investment | This is the total amount you spent. It includes the purchase price plus any other associated expenses like fees or labor. | You paid $10,000 for the stock plus $200 in brokerage fees. Your total cost is $10,200. |
| The Formula in Action | It's the Net Return divided by the Total Cost, then multiplied by 100 to express it as a percentage. | ($5,000 / $10,200) x 100 = 49% ROI |
This table makes it clear that you can't just look at the purchase price; you have to account for every dollar you spent to get an accurate picture of your true return.
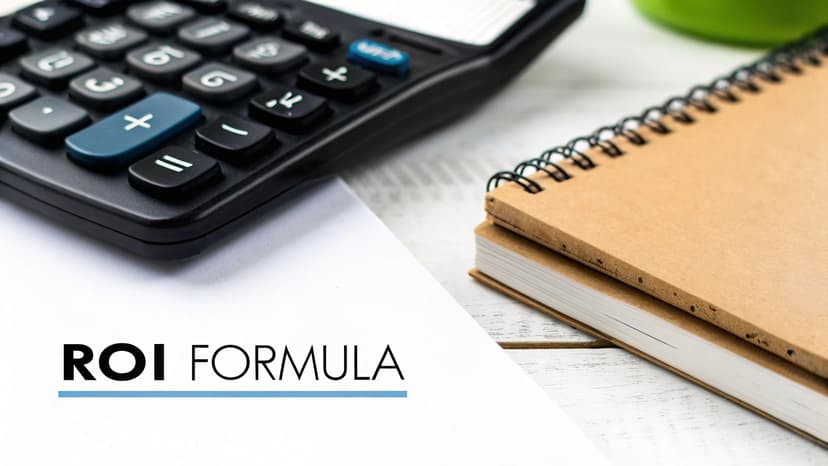
The Basic ROI Formula
The standard formula for Return on Investment is refreshingly direct. It cuts through the noise and gets right to the point of profitability. Here’s the classic equation:
ROI (%) = (Net Return on Investment / Cost of Investment) x 100
Let’s quickly walk through a real-world example. Say you invest $10,000 in a new piece of software for your team and spend an additional $500 on training. Your total Cost of Investment is $10,500.
Over the next year, that software helps your team increase sales, generating an additional $25,000 in profit. Your Net Return is $25,000. Your ROI calculation would look like this:
- ($25,000 / $10,500) x 100 = 238%
A 238% ROI is a fantastic result, showing the investment paid for itself more than twice over in just one year.
Why This Simple Ratio Matters
Calculating ROI is about more than just a pat on the back for a good decision. It gives you a standardized way to compare totally different opportunities on an even playing field. A 15% ROI from one project is clearly a better use of company money than a 5% ROI from another. It's that simple.
This is especially critical in business. For anyone in marketing, for instance, being able to prove the value of your campaigns is everything. For a much deeper look at this, you should check out these proven strategies and tips for measuring marketing ROI.
By mastering this one calculation, you’re not just crunching numbers—you’re equipping yourself with a powerful tool for smart, strategic financial thinking.
Putting the ROI Formula into Practice
Theory is one thing, but getting your hands dirty and applying the ROI formula to real-world situations is where it really clicks. Moving from a sterile equation to actual business decisions is how you build the confidence to size up your own investments.
Let's walk through a couple of common examples to see how it works in the wild.
The core process is straightforward: you gather all your costs, pinpoint all your gains, and then run the numbers.
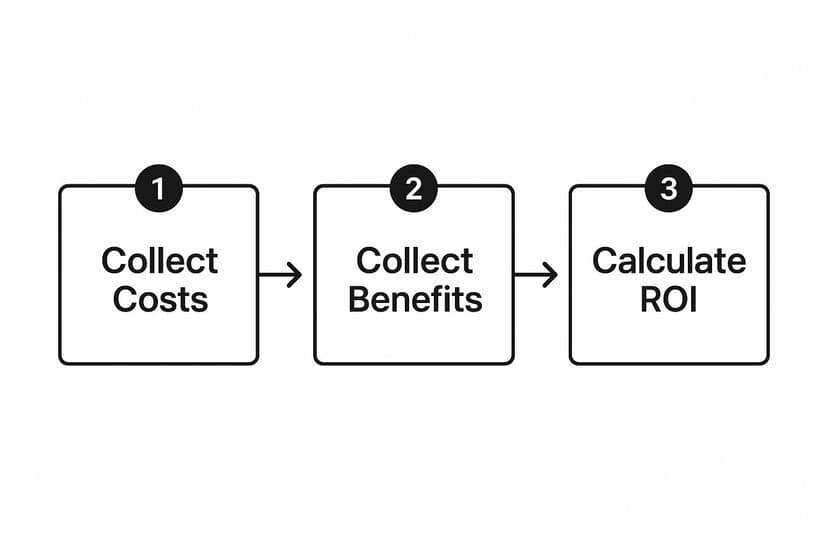
This visual just reinforces a crucial point: an accurate ROI calculation depends on being completely honest about both what you spent and what you gained. Every piece of the puzzle matters.
Analyzing a New SaaS Subscription
Imagine your sales team is drowning in manual data entry, and it's slowing down their entire pipeline. You decide to pull the trigger on a new CRM to automate the busywork.
The software has an annual subscription of $5,000. You also budget another $1,000 to bring in a consultant for setup and to get the team up to speed.
- Total Cost of Investment: $5,000 + $1,000 = $6,000
A year later, you look back at the results. With all that newfound free time, the team closed more deals, bringing in $22,000 in extra profit that you can directly attribute to the CRM.
Time to plug those numbers into our formula:
ROI (%) = (Net Return / Cost of Investment) x 100
($22,000 / $6,000) x 100 = 367%
A 367% ROI isn't just a good number; it's a game-changer. It’s undeniable proof that the software delivered far more value than it cost. Once you’re comfortable with this, you can apply the same logic to other areas, like calculating the return on click investment for your digital ads.
Evaluating a New Equipment Purchase
Now, let's switch gears to a manufacturing setting. A small business invests $50,000 in a new packaging machine to boost its production capacity. Throughout the first year, maintenance and operational expenses for the machine add up to $3,000.
- Total Cost of Investment: $50,000 + $3,000 = $53,000
The new machine is faster and more reliable, which translates directly to a net profit increase of $75,000 for the year.
Here’s how the ROI calculation shakes out:
- ($75,000 / $53,000) x 100 = 141.5%
Getting a 141.5% ROI shows the equipment more than paid for itself in its first year while generating a healthy profit on top. This kind of black-and-white calculation is essential for any major capital expenditure.
This same principle even applies to broader financial markets. For instance, you could calculate an index's average annual return by looking at five years of data: 28%, 18.7%, 19.9%, 23.1%, and 29.7%. Add them up (119.4%) and divide by five years, and you get an average historical return of 23.9% per year. It just goes to show how ROI clarifies performance in almost any context.
What’s a Good ROI? Interpreting Your Results
So you've calculated your return on investment. The number is staring back at you—maybe it’s 15%, maybe it's 150%. But what does that figure actually mean? Running the numbers is only half the battle.
A "good" ROI isn't a single, universal number. It’s a moving target that changes dramatically based on your industry, your appetite for risk, and the investment's time frame.
Think about it. A 10% annual return on a super-stable, low-risk government bond would be incredible. But if you got that same 10% return from a volatile startup investment, you'd probably be pretty disappointed. The massive risk involved demands a much higher potential payoff.
How to Set Your Benchmarks
To figure out if your ROI is impressive or just average, you need something to measure it against. Establishing the right benchmarks is crucial. Without them, you’re just guessing.
Here are a few things I always look at:
- Industry Averages: A real estate developer and a marketing agency are playing completely different games. Their ROI expectations for a project will be worlds apart.
- Cost of Capital: This one’s a biggie. Your ROI absolutely must be higher than the cost of the money you invested. If you took out a loan at 5% interest to fund the project, a 4% ROI means you’re actually losing money.
- Opportunity Cost: What could you have done with that money instead? If your project returned 7%, but you could have parked the cash in a simple index fund for a nearly guaranteed 6%, your real gain is only 1%.
Understanding these benchmarks turns a simple percentage into a powerful decision-making tool. It’s how you know if your investment is actually creating value or just treading water.
The Risk and Reward Trade-Off
The link between risk and expected ROI becomes obvious when you compare different types of investments. Publicly traded stocks, for example, have historically returned around 8% per year.
Now, consider a startup. With a failure rate hovering around 50%, investors need the potential for a much bigger win to make the gamble worth it—often four or five times higher. Someone sinking $200,000 into a new company is realistically hoping for a return closer to $1,000,000 to justify that risk.
This same logic applies to your internal business projects. A low-risk tweak to your operations might be perfectly acceptable with a 15% ROI. But a bold, unproven marketing campaign? You should be aiming for a much higher return to compensate for all that uncertainty.
To get a feel for what returns look like in different areas, you can explore metrics like What Is a Good ROAS.
Sample ROI Benchmarks by Investment Type
To give you a clearer picture, here’s a quick look at typical ROI expectations across different investment types. This isn't financial advice, but it helps put your own numbers into perspective.
| Investment Type | Risk Level | Typical Annual ROI Range |
|---|---|---|
| High-Yield Savings | Very Low | 1-5% |
| Government Bonds | Low | 2-6% |
| Index Funds (S&P 500) | Medium | 7-10% |
| Real Estate (Rental) | Medium-High | 8-12% |
| Individual Stocks | High | -20% to +30% (highly variable) |
| Angel/VC Investing | Very High | 20-50%+ (with high failure rate) |
As you can see, the higher the risk, the higher the potential (and necessary) return.
Ultimately, interpreting your ROI is an exercise in critical thinking. It requires you to look beyond the number itself and understand the full story. For a deeper dive into this, our guide on data analysis for managers is a great place to build those skills.
Building Your Own ROI Calculator in Excel
While the simple formula is great for a back-of-the-napkin calculation, a spreadsheet is where the real magic happens. If you're tracking multiple investments or want to dig deeper, using Microsoft Excel or Google Sheets is the way to go. It’s how you turn a one-off calculation into a dynamic financial dashboard you can use again and again.
Think of it this way: building a calculator in Excel lets you create a master template. You can duplicate it for new projects, line up different investments to see which one performs better, and even spot trends over time. It gives you a much richer, more complete picture.
Here’s what a simple, effective ROI calculator could look like in your spreadsheet.

This kind of setup gives you a clean, organized way to punch in your numbers and see the results instantly. It makes your financial analysis fast, efficient, and dead simple to understand.
Laying Out a Basic Template
First things first, open a blank sheet and label your columns clearly. Good organization from the start will save you a world of headaches later on. I always recommend columns for the investment name, all associated costs, total returns, and of course, the final ROI percentage.
Here's how I like to structure my sheets for clarity:
- Inputs: This is your data entry zone. Create dedicated rows for "Investment Name," "Initial Cost," and "Gross Return." This is the only place you'll be typing numbers.
- Calculations: This section is for the formulas. Make rows for "Net Return" and "ROI %." These cells will do the heavy lifting for you.
- Formatting: Make your headers bold. Use borders to create a visual box around your calculator. A little color-coding—like green for returns and red for costs—also goes a long way in making the sheet easy to read at a glance.
Separating your inputs from your calculations is a pro tip. It stops you from accidentally typing over a formula, which is an incredibly common (and frustrating) mistake.
The whole point is to build a tool where you only touch the "Inputs" section. The "Calculations" section should update on its own, giving you immediate answers without having to rewrite formulas every single time.
Plugging in the Core ROI Formulas
Okay, with your template laid out, it's time to make it work. This is where you'll really see the power of a spreadsheet for calculating ROI. Let's assume your labels are in column A and your numbers will go into column B.
It’s a straightforward process:
- Label Your Cells: In cells A1 through A5, type out your labels: Investment, Initial Cost, Gross Return, Net Return, and ROI (%).
- Enter Your Data: In cells B2 and B3, you'll plug in your actual numbers. For this example, let's put 5000 in B2 for the cost and 8000 in B3 for the return.
- Calculate Net Return: Click into cell B4 and type the formula
=B3-B2. This simply subtracts the cost from the gross return to find your net profit. - Calculate ROI Percentage: Now, in cell B5, enter the main formula:
=(B4/B2). To get it to look right, select the cell and click the percent style (%) button on the Home tab.
That's it! Now, any time you change the values in B2 or B3, your Net Return and ROI Percentage will update automatically. This simple setup is the backbone of any good financial model in a spreadsheet.
For anyone wanting to take their analysis to the next level, you can explore a whole range of other Excel financial formulas that handle more complex situations, like annualized ROI or discounted cash flow. You can also leverage an AI formula generator to speed up your calculations. This is how you go from a basic calculator to a truly professional-grade analysis tool.
Common Mistakes That Skew ROI Calculations

The ROI formula looks straightforward on the surface, but I've seen a few common slip-ups turn a solid-looking number into a dangerously misleading one. Getting this right is about more than just plugging numbers into a calculator; it's about making sound business decisions based on what’s actually happening.
One of the biggest culprits is overlooking the "hidden" costs. It's easy to remember the sticker price of a new software subscription, but what about all the employee hours spent on training and implementation? Those are very real expenses that directly eat into your returns.
If you ignore them, you're just artificially inflating your ROI and giving yourself a false sense of success.
Forgetting the Soft Costs
When you sit down to calculate ROI, you have to account for every single resource that went into the project. This means digging deeper than the obvious invoices and receipts.
You need to think about the indirect expenses, what we often call soft costs. They're easy to miss but absolutely critical for an honest calculation.
- Employee Time: How many hours did your team dedicate to this project instead of their usual tasks? Their salaries for that time are a real part of the investment.
- Training and Onboarding: Did you have to get staff up to speed on new tools or processes? The cost of that training, and the time it took, is a direct expense.
- Ongoing Maintenance: Some investments require continuous upkeep, like software updates or equipment servicing. These recurring costs must be factored into the equation from the start.
Failing to include these soft costs is like trying to bake a cake and leaving out the flour. The result might look okay from a distance, but it fundamentally lacks substance.
A truly accurate ROI calculation captures the total economic reality of an investment, not just the expenses that show up on a bill. It forces you to consider the full operational impact.
Ignoring the Element of Time
Another critical mistake I see all the time is failing to consider the investment's time frame. A 20% return sounds fantastic, but it's a lot less impressive if it took you five years to get there versus just six months.
The basic ROI formula doesn't have a built-in clock, which can create a distorted picture when you're comparing different projects. A project that delivers a 15% ROI in one year is often a much better use of capital than one that hits 20% ROI over three years.
To get around this, you can calculate an annualized ROI. This simple adjustment converts the return into a yearly figure, putting all your investments on a level playing field for a true apples-to-apples comparison. It gives you the context you need to understand how efficiently your investment is working for you. For anyone wrestling with complex datasets, mastering Excel report automation can be a game-changer for streamlining these more nuanced calculations and preventing manual errors.
Common Questions We Hear About Calculating ROI
Once you get the hang of the basic ROI formula, the real-world questions start popping up. It's one thing to understand the math, but it's another to apply it to messy, real-life business scenarios. Let's dig into some of the most frequent questions I get asked.
Getting these details right is the difference between a calculation that’s just correct and one that’s actually useful.
ROI vs. ROE and ROA
It’s easy to get these acronyms mixed up, but they tell very different stories. The key difference is scope. Think of ROI as your magnifying glass—it’s perfect for measuring the profitability of one specific investment, like that new marketing campaign you just launched or the new equipment you bought for the factory floor.
ROE and ROA, on the other hand, are like wide-angle lenses for viewing the financial health of the entire company.
- Return on Equity (ROE) tells you how well the company is using money from shareholders to make a profit.
- Return on Assets (ROA) measures how much profit the company is squeezing out of everything it owns (its total assets).
So, while ROE and ROA give you the big picture on corporate performance, ROI is your go-to for making sharp, project-level decisions.
Can ROI Be a Negative Number?
Absolutely. And when it is, you need to pay close attention. A negative ROI is a clear sign that an investment has lost money. The costs were simply higher than any money it brought back in.
For instance, an ROI of -25% means for every dollar you put in, you got 75 cents back. You lost a quarter of your initial capital. This isn't just a number on a spreadsheet; it’s a red flag telling you that a particular strategy isn't working and needs a serious rethink or needs to be cut altogether.
A negative ROI isn’t just a failure—it's a tuition payment. It forces you to figure out what went wrong. Were costs underestimated? Were returns overblown? Was the execution just plain clumsy? Answering these questions is how you get smarter for the next investment.
How Do I Factor in Taxes?
If you want a true picture of what an investment is doing for your bottom line, you have to look at it after taxes. A pre-tax ROI might look great on paper, but it's not the cash you can actually take to the bank.
The adjustment is pretty simple. First, figure out the net profit from the investment before taxes. Then, subtract whatever corporate or capital gains taxes apply to get your true, after-tax profit. When you plug that number into the "Net Return" part of your formula, you get a much more realistic view of the investment's performance.
What Are the Limits of ROI?
ROI is a fantastic tool, but it has one big blind spot: it doesn't consider time. The standard formula sees a 20% return earned in one month as the exact same thing as a 20% return that took five long years to achieve.
This can be a real problem when you're trying to compare investments with different lifespans. To get around this, savvy analysts often calculate an "annualized ROI," which levels the playing field by showing the return over a standard one-year period. It’s also worth remembering that in a complex business, it can be tricky to perfectly assign every single cost and every bit of revenue to one investment, which can sometimes fudge the numbers if you aren't careful.
Ready to stop wrestling with spreadsheets and start getting instant answers from your data? Elyx.AI integrates directly into Excel, allowing you to ask questions in plain English, automate complex calculations, and visualize your ROI trends in seconds. Find out how Elyx.AI can transform your financial analysis.
Reading Excel tutorials to save time?
What if an AI did the work for you?
Describe what you need, Elyx executes it in Excel.
Sign up