5 Steps to Build a Budget vs Actual Report in Excel

Think of budget vs actual reporting as your company's financial GPS. It's a straightforward but powerful analysis that pits your planned budget against what actually happened, financially speaking. This process, often called variance analysis, is a crucial reality check, showing you the difference between the financial road you planned to take and the one you traveled.
What Is Budget vs Actual Reporting

At its heart, budget vs actual reporting breathes life into your financial plan, turning it from a static document into a dynamic tool you can use to navigate the messy reality of business. It gives you a structured method for seeing where your strategy is paying off and, just as importantly, where you've gone off course.
Spending too much time on Excel?
Elyx AI generates your formulas and automates your tasks in seconds.
Sign up →This constant feedback is what enables smart, agile decision-making. You're better equipped to react to sudden market shifts, solve operational hiccups, or jump on unexpected growth opportunities. The whole analysis really boils down to three key parts: the budget, the actuals, and the variance. Getting a handle on these is the first real step toward gaining tighter financial control.
The Core Components Explained
This isn't just an exercise in catching overspending; it’s a deep dive into performance. Finding a gap between your financial plans and the final numbers is incredibly common. In fact, some research shows that 62% of mid-to-large companies report that their actual operating expenses miss their budget by over 10%.
But here's the encouraging part: businesses that consistently perform this analysis see a 23% improvement in forecast accuracy, which proves how effective it is for sharpening your financial strategy over time. You can learn more about these figures by looking into budget vs actual reporting research.
Key Takeaway: The point of budget vs actual reporting isn't to hit your budget perfectly every single time. It's to understand why the numbers are different and use that knowledge to make more informed decisions down the road.
To lay the groundwork, let's look at the basic building blocks of this process. The table below breaks down each fundamental element to give you a quick, clear understanding.
Core Components of Budget vs Actual Reporting
| Component | Definition | Primary Purpose |
|---|---|---|
| Budget | A forward-looking financial plan detailing expected income and expenses for a future period. | To set financial goals, allocate resources, and establish a performance benchmark. |
| Actuals | The real financial results (revenue and costs) that occurred during that same period. | To provide a factual record of historical performance and business activities. |
| Variance | The difference calculated by subtracting the budgeted amount from the actual amount. | To quantify deviations from the plan, highlighting areas that require investigation. |
With these three components—the plan, the reality, and the difference—you have everything you need to start asking the right questions and steering your business with greater confidence.
The Strategic Benefits of Regular Variance Analysis

Consistently performing variance analysis is about much more than just spotting where you overspent. It’s a core discipline for running an intelligent business. When you regularly pit your budgeted figures against what actually happened, you empower leaders to make decisions based on solid evidence, not just gut feelings. This gives you the clarity to either pivot away from a failing strategy or confidently double down on what’s working.
The insights you gain from budget vs actual reporting also make your future financial planning sharper. You're no longer just guessing. Your historical variance data becomes an incredible asset, showing you patterns that help you build more accurate and realistic budgets year after year. This iterative cycle strengthens your company's entire financial foundation.
Fostering Accountability and Proactive Management
One of the biggest wins from this practice is the accountability it builds. When department heads are part of the review process for their own variances, they take real ownership of their financial performance. It’s a transparent system that ties their day-to-day decisions directly to the company's health, encouraging smarter spending and resource management across the board.
Think of variance analysis as your financial early-warning system. Instead of reacting to a cash flow crisis after the damage is done, you can spot negative trends just as they start to form. This proactive approach lets you get ahead of problems, like creeping material costs or a dip in sales, before they snowball into major headaches.
The numbers don't lie. A survey of 1,000 corporations found an average budget variance of 12.7% in revenue and 14.3% in expenditures. What's more, companies that checked their variances every month saw up to 30% better cash flow management than those who only reviewed them quarterly or annually.
Key Insight: Regular variance analysis changes your financial posture from reactive to proactive. It empowers you to anticipate challenges and make strategic adjustments with foresight, rather than hindsight.
Improving Operational Efficiency and Resource Allocation
At the end of the day, the goal is to run the business better. By digging into where and why variances are happening, you can uncover operational inefficiencies that would otherwise fly under the radar. For instance, a consistent negative labor variance might signal a need for improved training programs or a workflow that needs a serious overhaul.
This knowledge naturally leads to smarter resource allocation. It gives you the confidence to pull funding from underperforming projects and redirect it to initiatives that are actually delivering a positive return. It’s how you ensure every dollar is aligned with your strategic objectives.
To truly get the most out of this process, it helps to follow established financial principles. Sticking to essential financial reporting best practices ensures your data is clean, reliable, and ready for deep analysis. When you pair these practices with tools that support https://www.getelyxai.com/en/blog/financial-reporting-automation, this discipline becomes an even more potent engine for growth.
Comparing the Budget and the Actuals
To get a real handle on budget vs. actual reporting, you have to appreciate the distinct jobs the budget and the actuals do. They aren't adversaries; think of them as two sides of the same coin in your financial strategy. I like to see the budget as the detailed blueprint for a house, while the actuals are the photos of the finished construction. You need both to understand the full story.
The core differences boil down to their purpose, the data they use, and when they come into play. Your budget is the proactive plan, and the actuals are the reactive results. Getting how they work together is the key to shifting from basic reporting to making sharp, informed decisions.
Purpose: The Plan vs. The Result
The main point of a budget is to act as a financial roadmap. It's a forward-looking document, carefully built from strategic goals, educated guesses about operations, and past performance data. You create it to set clear expectations, establish spending guardrails, and get every team pulling in the same financial direction.
On the flip side, the actuals are the documented financial reality. They are a historical record of what really went down—every dollar earned, every bill paid, every expense that hit the books. The purpose isn't to plan but to give you a concrete, factual summary of what happened. One sets the target; the other shows you precisely where the arrow landed.
A budget is a statement of intent, built on careful estimates and ambitious goals. Actuals are a statement of fact, built on hard transactions. The magic of budget vs. actual reporting is how it connects that intention to the ultimate reality.
The chart below gives a great visual of this comparison, showing budgeted figures against actual results for revenue and expenses, which immediately highlights the variance.
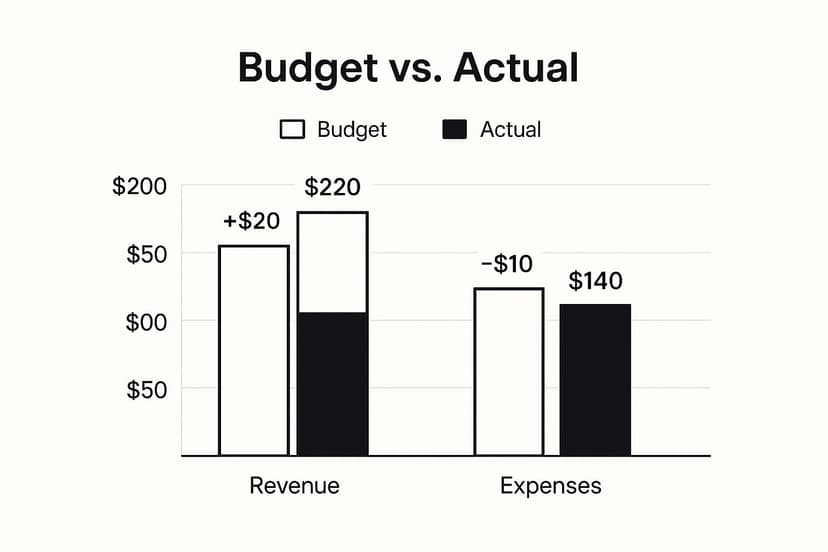
You can see right away there's an unfavorable revenue variance but a favorable expense variance. This gives you a quick, at-a-glance health check on performance against the plan.
Data Source and Timing
The information feeding these two reports couldn't be more different. Budget numbers are pieced together from estimates, forecasts, and strategic assumptions. It’s a process that involves predicting future market trends, projecting sales numbers, and anticipating operational costs. At its heart, it’s an exercise in educated forecasting.
Actuals, however, are pulled directly from recorded transactions. This data flows straight from your accounting software, payroll system, and bank statements. There’s no guesswork here; it's a pure historical record of real financial events.
This fundamental difference in data source is directly linked to their timing. A budget is always created before a financial period starts, looking ahead to what you aim to accomplish. Actuals can only be put together after the period is over, looking back at what already took place. This is where the synergy happens: looking forward, then reviewing what happened. This creates a powerful, continuous cycle of planning, doing, and analyzing that really drives financial improvement.
How to Build a Budget vs Actual Report
You don't need fancy, expensive software to build an insightful budget vs actual report. In fact, you can create a seriously powerful one using a tool you probably have open right now: Microsoft Excel. The trick is to structure it correctly from the start, turning what could be a jumble of numbers into a clear story about your financial performance.
First things first, let's get your spreadsheet organized. Create a few essential columns: one for your budget categories (like "Marketing Spend," "Salaries," or "Software Subscriptions"), another for the budgeted amount, and a third for the actual spend. Getting this basic structure right is the key to making everything else easy.
A clean, well-organized report allows for quick comparisons and sets you up for much deeper analysis. Think of it as turning a static spreadsheet into a dynamic tool for making smarter decisions.

Calculating Key Variances
With your data neatly laid out, it's time to calculate the variance. This is where you measure the gap between your plan and what actually happened. I always calculate both the dollar variance and the percentage variance because each one gives you a different piece of the puzzle.
-
Dollar Variance: This one's just simple subtraction. In a new column, the formula is
= Actual Amount - Budgeted Amount. If the result is positive, you've overspent (unfavorable); if it's negative, you came in under budget (favorable). -
Percentage Variance: This adds critical context. The formula is
=(Dollar Variance / Budgeted Amount). A small dollar difference can sometimes represent a huge percentage swing on a smaller budget item, which is something you definitely want to catch.
Key Insight: A $500 overspend on a $1,000 budget (50% variance) is a much bigger deal than a $500 overspend on a $50,000 budget (1% variance). Percentage variance helps you focus on what really matters.
Enhancing Readability and Automation
To make your report easy to read at a glance, lean on Excel's conditional formatting. You can set up simple rules to automatically color-code your variances—for example, making any unfavorable dollar amount turn red. This kind of visual shortcut immediately draws your eye to problem spots before you even have to read the numbers.
While building this manually in Excel works great, you can save a lot of time by exploring tools for automated report generation. This helps cut down on the manual grind and reduces the chance of human error, which is especially important when you're working with a lot of data.
You can also bring AI into the mix to sharpen your analysis. A tool like Elyx.AI, for instance, can automate data imports and generate summaries right within your spreadsheet environment. For anyone who lives in Excel, learning about Excel reporting automation can be a game-changer, giving you back precious time to think strategically instead of just punching in numbers.
Interpreting Variances with Real Scenarios
Seeing the numbers on a budget vs. actual report is just the starting line. The real magic happens when you start asking why those numbers are what they are. Think of a variance as a signpost, pointing you to a part of the business that deserves your attention.
It’s tempting to label a "favorable" variance as good and an "unfavorable" one as bad, but that’s an oversimplification. You have to dig into the context to understand the story behind the data. This is where raw numbers transform into genuine management insights.
The Favorable Sales Variance
Let's say your report flags a $50,000 favorable sales variance. Great news, right? Actual revenue came in higher than you budgeted. Before popping the champagne, you need to find out what drove that extra income.
The reason could be one of two very different stories:
- A successful marketing campaign? Maybe a new ad campaign really clicked with customers, driving a higher sales volume than you projected. This is a clear win. It tells you the marketing strategy is working and you might want to double down on it.
- An unexpected price increase? What if you had to raise prices to meet the revenue goal, but actually sold fewer units? This "favorable" variance could be a warning sign. It might signal customer price sensitivity and could hurt your brand's long-term health.
The Unfavorable Materials Cost Variance
Now, let's look at the flip side. Imagine you see a $20,000 unfavorable materials variance. You spent more on raw materials than planned, which on the surface looks like a budget miss. But again, the cause is what really matters.
A variance only tells you what happened, not why. The "why" is where strategic insights are born, transforming a simple report into a guide for better decision-making.
This overspend could be coming from a few places:
- Supplier Price Hikes: Perhaps your main supplier jacked up their prices without much warning. This is an external pressure, not an internal slip-up. It's a clear signal to start renegotiating or look for new vendors.
- Higher-Quality Materials: Maybe you deliberately chose to buy more expensive materials to improve product quality. If this led to fewer defects and happier customers, the unfavorable cost variance could easily be offset by a very favorable revenue variance later on.
- Internal Inefficiencies: On the other hand, the variance could be from waste on the production line or spoilage. This points to an operational issue that your team needs to address head-on.
Getting comfortable with this kind of analysis is what separates good managers from great ones. To learn more about turning numbers into actionable strategies, check out our guide on data analysis for managers.
Grappling with Common Reporting Headaches
In theory, budget vs. actual reporting sounds straightforward. In practice, it's often a minefield of frustrating obstacles. I've seen countless organizations get bogged down, turning what should be a powerful strategic tool into a dreaded administrative task. Learning to sidestep these common issues is what separates a truly effective reporting system from one that just goes through the motions.
One of the biggest culprits is delayed or inconsistent data collection. Picture this: the finance team is spending the first week of every month just chasing down numbers from different departments. By the time the report is compiled, the data is already stale. This lag makes it impossible to react quickly, completely undermining the point of the whole exercise.
Another challenge I see all the time is the struggle to create an accurate budget to begin with. Budgets can easily become political. Some managers might pad their numbers to build a comfortable cushion, while others might be overly optimistic to get their pet projects approved. When the starting point is flawed, any variance analysis built on it will be misleading at best.
Getting to the Root of the Problem
To really fix these issues, you need a more connected approach. Instead of treating data gathering as a manual, once-a-month fire drill, think about using software that can automatically pull information from all your different sources. This doesn't just speed things up; it dramatically cuts down on the risk of human error.
- Tackling Data Delays: Look into integrated software or cloud-based accounting platforms that sync data in near real-time. This ensures that when you sit down to analyze your budget vs. actuals, you’re looking at what’s happening now, not last month.
- Improving Budget Accuracy: Make budgeting a team sport. Don't just ask department heads for their numbers; bring them into the process for their insights. This collaboration builds a sense of shared ownership and results in forecasts that are grounded in reality, not just wishful thinking.
A budget created in a silo is destined to fail. Real accuracy comes from a blend of historical data, strategic goals, and the practical knowledge of the people on the front lines.
Separating the Signal from the Noise
Finally, a major hurdle is knowing how to read the results. It's easy to get lost in a sea of numbers and overreact to every minor blip. The real skill is learning to tell the difference between a one-off fluke and a genuine trend that points to a deeper problem.
For example, a single month of high supply costs because of a temporary market shortage is just noise. But, if you see those costs creeping up quarter after quarter, that's a signal. It tells you it's time to take a hard look at your procurement strategy or supplier contracts. Setting clear thresholds for when a variance needs a closer look—say, anything over 10%—helps you focus your energy where it actually matters and avoid getting stuck in analysis paralysis.
Frequently Asked Questions
As you start putting these reporting principles into practice, you're bound to run into a few specific questions. Let's tackle some of the most common ones that come up when getting into the nitty-gritty of budget vs. actuals.
How Often Should We Be Doing Budget vs. Actual Reporting?
This really comes down to the rhythm of your business. For most companies, a monthly review is the sweet spot. It’s frequent enough to catch problems early but doesn't bog your team down with constant reporting.
That said, if you're in a fast-paced or volatile industry, you might find weekly check-ins on critical numbers give you the agility you need. On the flip side, anything less than a quarterly review is risky—it’s just too easy for a small variance to balloon into a major issue if left unchecked for that long.
The real aim is to find a cadence that lets you make meaningful course corrections before it's too late. Monthly reviews usually hit that perfect balance, lining up nicely with standard accounting cycles while still providing timely, actionable data.
Does a Budget Always Have to Break Even?
That’s a common myth, especially in the nonprofit world. The short answer is no. A for-profit business, by its very nature, should be budgeting for a profit, meaning your planned revenue is higher than your planned expenses.
Even for nonprofits, aiming for a surplus is just smart financial management. A planned surplus acts as a vital safety net, helping you handle unexpected costs, weather a dip in donations, or build up reserves for future projects and long-term stability. It’s not about hitting zero; it’s about building a foundation for financial health.
What’s the Real Difference Between a Static and a Flexible Budget?
Getting this right is crucial for any meaningful variance analysis. The core difference is how your budget responds to what actually happens in your business.
- Static Budget: Think of this as a budget set in stone. It’s built for one specific level of activity—say, selling 10,000 units—and it doesn’t change, even if you end up selling 15,000. It's a fixed yardstick.
- Flexible Budget: This is a much more dynamic tool. It adjusts your budgeted costs based on your actual activity level. So, it calculates what your expenses should have been for the volume you actually achieved, giving you a far more apples-to-apples comparison.
When you're digging into why your numbers are off, a flexible budget is almost always more insightful. It helps you separate issues with cost control from variances that are simply due to selling more or less than you originally planned.
Tired of battling complex formulas just to get basic insights? Elyx.AI plugs right into Excel and handles your budget vs. actual reporting using simple, everyday language. You can ask it to calculate variances, summarize performance, and create charts in an instant. This frees you up to think about strategy, not spreadsheets. See how much time you could save by visiting the Elyx.AI website.
Reading Excel tutorials to save time?
What if an AI did the work for you?
Describe what you need, Elyx executes it in Excel.
Sign up