8 Powerful Excel Data Analysis Tips for 2025

In today's data-driven environment, mastering Excel is no longer just about creating simple tables. It's about transforming raw numbers into strategic business assets. Whether you're a financial analyst, a marketing professional, or an operations manager, your ability to efficiently analyze data directly impacts your effectiveness and decision-making. Yet, many professionals only scratch the surface of what's possible, often getting bogged down by manual processes, repetitive tasks, and inefficient workflows that consume valuable time.
This guide is designed to change that. We've compiled a list of powerful Excel data analysis tips that move beyond the basics to deliver actionable results. You will learn how to automate complex tasks and unlock deeper insights hidden within your datasets.
We'll cover everything from dynamic summarization with PivotTables and advanced filtering to automated data transformation with Power Query. You will also discover how to leverage modern features like Dynamic Array formulas and build interactive dashboards that bring your data to life. Prepare to elevate your skills, save countless hours, and make more informed, data-backed decisions. This comprehensive roundup will equip you with the practical knowledge needed to turn your spreadsheets into powerful analytical tools.
Spending too much time on Excel?
Elyx AI generates your formulas and automates your tasks in seconds.
Sign up →1. Master PivotTables for Dynamic Data Summarization
PivotTables are one of Excel's most powerful data analysis tools, allowing you to transform massive datasets into concise, interactive summaries. Instead of relying on complex formulas, you can drag and drop data fields to instantly aggregate, categorize, and analyze information. This dynamic functionality is a cornerstone of many effective Excel data analysis tips, enabling you to spot trends and insights that are often hidden in raw data.
A PivotTable can, for instance, take thousands of rows of sales transactions and summarize them into a clear report showing total sales per region, per product, or per quarter. This ability to cross-tabulate and restructure data on the fly makes it an indispensable tool for anyone serious about data exploration in Excel.

Why PivotTables are Essential
The primary benefit of a PivotTable is its ability to provide a flexible summary of your data. You can quickly answer complex business questions without writing a single formula. For example, an HR manager can analyze employee performance data by department and tenure, while a marketing team can dissect survey results by demographic segments.
This tool is particularly useful when you need to explore data from multiple angles. You can easily pivot your view by moving fields between rows, columns, and value areas, allowing for rapid hypothesis testing and discovery.
Actionable Tips for Effective PivotTables
To get the most out of this feature, follow these best practices:
- Prepare Your Source Data: Ensure your dataset is in a tabular format with no blank rows or columns. Each column should have a unique, descriptive header.
- Group Data for Clarity: Use the Group feature to consolidate date fields into months, quarters, or years for time-series analysis. You can also group numeric fields to create value ranges.
- Keep Data Fresh: If your source data changes, your PivotTable won't update automatically. Remember to right-click the PivotTable and select Refresh to sync it with the latest information.
- Use Slicers and Timelines: For a more interactive experience, insert Slicers and Timelines. These visual filters allow you and other users to easily drill down into specific data subsets, turning your report into a simple dashboard.
2. Leverage Advanced Filtering and Sorting Techniques
Excel's advanced filtering and sorting go far beyond basic A-Z ordering, allowing you to manipulate and isolate data based on complex, multi-layered criteria. Instead of manually sifting through rows, you can define specific rules to instantly extract the exact records you need. This powerful functionality is one of the most practical Excel data analysis tips for cleaning and preparing datasets for deeper investigation.
For instance, you can use Advanced Filter to extract a list of all sales records from a specific region that exceeded a certain value, all while excluding a particular product line. This ability to apply sophisticated logic without complex formulas allows you to quickly segment large datasets and focus only on the information that matters most for your analysis.
Why Advanced Filtering and Sorting are Essential
The primary benefit of these features is the precision they offer in data segmentation. You can quickly answer detailed questions that would otherwise require cumbersome manual work or intricate functions. For example, a financial analyst can sort transactions first by date and then by amount within each day, while a marketing manager can filter a customer list to find high-value clients in a target demographic who have not made a purchase in the last six months.
This capability is crucial when dealing with nuanced datasets where simple filters are insufficient. By setting up a dedicated criteria range, you can create intricate "AND/OR" conditions, effectively querying your spreadsheet like a database to pinpoint highly specific subsets of information.
Actionable Tips for Effective Filtering and Sorting
To get the most out of these features, follow these best practices:
- Format Data as a Table: Before applying filters, convert your data range into an Excel Table (Ctrl+T). This provides a more robust filtering experience with structured references and filter buttons automatically added to headers.
- Use a Criteria Range: For the Advanced Filter feature, set up a separate area on your worksheet to define your filtering rules. This allows you to build complex conditions, such as finding records that meet criteria A and B, or criteria C.
- Create Custom Sort Lists: When standard alphabetical or numerical sorting isn't enough, create a custom list. This is perfect for sorting by non-standard categories like "High," "Medium," and "Low" priority levels or specific business regions.
- Combine with Conditional Formatting: After filtering your data, apply conditional formatting to highlight key values visually. This adds an immediate layer of insight, making it easier to spot trends or outliers in the filtered subset.
3. Implement Conditional Formatting for Visual Data Insights
Conditional formatting is a powerful feature that automatically applies visual cues like colors, icons, and data bars to cells based on their values. Instead of manually scanning rows of numbers, you can use this tool to make important data points, outliers, and trends pop out visually. This is one of the most immediate and effective excel data analysis tips for transforming a static spreadsheet into a dynamic and intuitive report.
For example, a project manager can instantly see which tasks are overdue with red highlighting, while a sales manager can use a color-scale heat map to identify top-performing regions at a glance. This technique adds a layer of visual analysis directly onto your raw data, making it easier to interpret complex information quickly and accurately.
Why Conditional Formatting is Essential
The main advantage of conditional formatting is its ability to translate data into immediate visual signals. This saves time and reduces the cognitive load required to identify critical information. Instead of relying on sorting and filtering alone, you can create rules that automatically flag data that meets specific criteria, such as sales figures below target or inventory levels running low.
This feature is invaluable for creating dashboards and reports that are easy for anyone to understand, regardless of their Excel expertise. It helps you focus attention on what matters most, whether you're presenting financial results to stakeholders or tracking key performance indicators for your team.
Actionable Tips for Effective Conditional Formatting
To make the most of this visual tool, follow these best practices:
- Start with Simple Rules: Begin with basic built-in rules like "Highlight Cells Rules" or "Top/Bottom Rules" before moving to more complex formula-based conditions.
- Use Color Scales and Icon Sets: Apply Color Scales to visualize data distribution across a continuous range, like performance scores. Use Icon Sets, such as traffic lights or progress indicators, for categorical data like project statuses (e.g., "On Track," "At Risk," "Complete").
- Manage Your Rules: As you add more rules, use the Conditional Formatting Rules Manager (found under the Conditional Formatting dropdown) to edit, reorder, or delete rules to avoid conflicts.
- Apply to Entire Columns: When setting up a rule, apply it to the entire column (e.g.,
$A:$A) instead of just the current selection. This ensures the formatting automatically extends to new data you add later.
4. Utilize Data Validation and Input Controls
Reliable analysis depends on reliable data. Data Validation is a critical feature in Excel that acts as a gatekeeper for your datasets, ensuring accuracy and consistency by controlling what users can enter into cells. By setting up rules and constraints, you prevent common data entry mistakes from the start, which is a fundamental practice among advanced Excel data analysis tips.
This proactive approach to data quality management is essential for maintaining the integrity of your analytical models. For example, you can restrict entries in a project timeline to fall within a specific date range or ensure that product codes entered match a master list. This simple step saves countless hours of cleaning messy data later on and ensures your conclusions are based on sound information.
Why Data Validation is Essential
The core benefit of Data Validation is its ability to enforce standardization across your dataset, which is crucial for accurate aggregation and analysis. It reduces the risk of human error, such as typos or incorrect formatting, that can derail functions, formulas, and PivotTables. This is especially important in collaborative environments where multiple users input data.
By guiding users to enter data correctly, you create a more robust and error-resistant workbook. For instance, a finance team can use it to ensure budget entries are within approved limits, while an HR department can validate that employee performance grades are selected from a predefined list (e.g., A, B, C), preventing invalid entries from skewing reports.
Actionable Tips for Effective Data Validation
To implement this feature effectively, consider these best practices:
- Create Dynamic Dropdown Lists: Use named ranges to create dropdown lists. When you update the named range, the dropdown list updates automatically, making it easy to manage your options.
- Combine with Conditional Formatting: Enhance your validation with visual cues. Use Conditional Formatting to highlight cells with invalid entries, making them immediately obvious to the user.
- Write Clear Error Messages: Customize the input and error messages in the Data Validation settings. Provide clear instructions on what data is expected and guide users on how to correct mistakes.
- Use Dependent Dropdowns: For hierarchical data, create dependent (or cascading) dropdown lists. For example, a user's selection in a "Country" dropdown can filter the available choices in a "City" dropdown, streamlining data entry. To explore more advanced scenarios, you can learn more about Excel data validation examples.
5. Master Dynamic Array Formulas and XLOOKUP
Modern Excel's dynamic array formulas and functions like XLOOKUP represent a paradigm shift in data analysis, enabling more flexible, powerful, and intuitive data manipulation. These functions automatically "spill" results across multiple cells from a single formula, eliminating the need to copy formulas down columns and providing a more robust alternative to traditional functions. This dynamic behavior is a game-changer for building reports that automatically adjust to changes in your source data.
For instance, you can create an employee directory that automatically updates when a new person is added or a sales report that expands as new data is entered. Functions like FILTER, SORT, and UNIQUE can be combined to create live, sorted, and de-duplicated lists based on multiple criteria, making them essential excel data analysis tips for creating interactive dashboards and reports without complex legacy formulas.
Why Dynamic Arrays and XLOOKUP are Essential
The core advantage of this modern toolset is its efficiency and simplicity. A single dynamic array formula can replace hundreds of traditional Ctrl+Shift+Enter (CSE) array formulas or helper columns. XLOOKUP on its own replaces both VLOOKUP and HLOOKUP, offering greater flexibility by searching from right-to-left, returning multiple values, and handling errors natively without an IFERROR wrapper.
This functionality is crucial for analysts who need to build scalable and low-maintenance models. When your source data grows or shrinks, dynamic array formulas adjust the output range automatically. This "spill" behavior reduces the risk of formula errors and makes your spreadsheets far more resilient and easier to audit.
Actionable Tips for Effective Implementation
To leverage these modern functions, apply these best practices:
- Embrace the Spill: When a dynamic formula populates multiple cells, you can reference the entire spilled range by adding a hash symbol (#) to the cell containing the original formula (e.g.,
=A2#). - Combine Functions for Power: Chain dynamic array formulas together. For example, use
SORT(FILTER(…))to create a list that is both filtered by specific criteria and sorted in a desired order, all from one formula. - Replace Legacy Lookups: Make
XLOOKUPyour default for all lookup tasks. Its versatility and straightforward syntax makeVLOOKUPandINDEX-MATCHlargely obsolete for most use cases. - Generate Unique Lists Instantly: Use the
UNIQUEfunction to extract a list of unique values from a range. This is perfect for populating data validation dropdowns or creating summary tables without manual de-duplication.
6. Create Interactive Dashboards with Slicers and Charts
An Excel dashboard elevates data analysis from static reports to dynamic, interactive experiences. By combining charts, PivotTables, and key metrics into a single view, you can create a powerful tool for visual storytelling. This is one of the most impactful excel data analysis tips because it empowers stakeholders to explore data on their own terms, drilling down into specifics without needing manual report adjustments.
Dashboards are particularly effective for presenting complex information in an easily digestible format. Imagine an executive sales dashboard that allows a user to filter results by region, product line, and time period with just a few clicks. This level of interactivity transforms a simple spreadsheet into a sophisticated business intelligence tool, enabling faster, more informed decision-making.

Why Interactive Dashboards are Essential
The main advantage of a well-designed dashboard is its ability to communicate key performance indicators (KPIs) at a glance while providing the depth for further exploration. Instead of generating multiple reports for different queries, you can build one central dashboard that serves various analytical needs. For example, an HR team can monitor employee turnover, satisfaction scores, and recruitment pipelines from a single, unified interface.
This approach is invaluable when presenting data to non-technical audiences. Interactive elements like Slicers and Timelines make data filtering intuitive, allowing anyone to uncover insights without knowing complex Excel functions. Learn more about how to create compelling charts in Excel to form the foundation of your dashboard.
Actionable Tips for Effective Dashboards
To build a professional and functional dashboard, adhere to these guidelines:
- Start with Key Questions: Before you begin, define the primary questions your dashboard should answer. This will guide your design and ensure you include the most relevant metrics.
- Maintain Visual Consistency: Use a consistent color scheme, font, and formatting style across all charts and elements. A cohesive design improves readability and professionalism.
- Logical Grouping: Arrange related charts and data points together. For instance, place all sales-related metrics in one section and customer satisfaction data in another.
- Keep It Clean and Uncluttered: Avoid overwhelming the user with too much information. Use whitespace effectively and focus only on the most critical data to prevent "analysis paralysis."
- Include Refresh Instructions: Clearly label how to update the data, especially if the dashboard is linked to a source that changes frequently. A simple "Right-click and Refresh" note can be very helpful for users.
7. Implement Power Query for Data Transformation
Power Query is Excel's built-in ETL (Extract, Transform, Load) tool that revolutionizes how you prepare data for analysis. It allows you to connect to various data sources, perform complex cleaning and shaping operations, and automate the entire workflow. This is one of the most critical Excel data analysis tips for anyone dealing with messy, inconsistent, or multi-source data that requires significant preparation before it can be used.
Instead of manually cleaning data each time you receive a new file, Power Query records your transformation steps. You can combine sales data from multiple regional files, standardize customer information from CRM exports, or merge employee data from separate HR and payroll systems. Once set up, you can refresh the entire process with a single click, saving countless hours and eliminating manual errors.
Why Power Query is Essential
The core value of Power Query lies in its ability to create a repeatable, automated data preparation pipeline directly within Excel. It handles the "dirty work" of data analysis, such as removing duplicates, splitting columns, unpivoting data, and merging tables. This ensures your source data is always clean, structured, and ready for analysis in a PivotTable or data model.
This tool is indispensable when your data comes from external systems like databases, web pages, or folders containing multiple files. For instance, an analyst can build a query to scrape financial data from a website, clean it, and load it into a worksheet, with the ability to refresh the data on a set schedule.
The following process flow diagram illustrates the core Power Query workflow, from connecting to data sources to loading the transformed data into Excel.
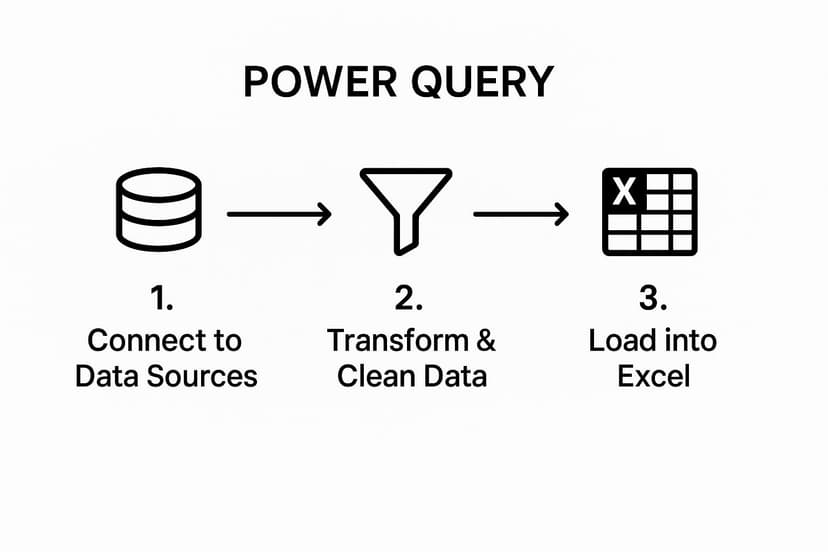
This simple three-step process is the foundation of powerful data automation, turning complex manual tasks into a streamlined, refreshable query.
Actionable Tips for Effective Power Query Use
To leverage Power Query for robust data transformation, consider these best practices:
- Name Your Steps: By default, Power Query gives generic names to transformation steps. Rename them to be descriptive (e.g., "Removed_Duplicate_Rows") to make your query easier to understand and debug later.
- Filter and Remove Early: To improve performance, filter out unnecessary rows and remove unneeded columns as early as possible in your query. This reduces the amount of data processed in subsequent steps.
- Don't Hardcode Values: Avoid hardcoding values directly in formulas. Instead, create separate tables or named ranges in Excel for parameters (like a date or region) and reference them in your query.
- Document Complex Logic: For intricate transformations involving custom M code, use comments to explain the logic. This is invaluable for future maintenance by you or your colleagues. You can learn more about how this contributes to building robust systems in our guide on how to automate Excel.
8. Apply Statistical Functions and Analysis ToolPak
Beyond basic calculations, Excel offers a robust suite of statistical functions and an entire Analysis ToolPak add-in for more advanced work. These tools allow you to perform descriptive and inferential statistics directly within your workbook, making sophisticated data analysis accessible without needing specialized software. This is one of the most powerful Excel data analysis tips for anyone needing to validate findings or make predictions based on data.
Whether you're running a regression analysis to see how marketing spend affects sales, or calculating the standard deviation of quality control measurements, these features provide the statistical horsepower for data-driven decision-making. The Analysis ToolPak, in particular, can generate detailed summary tables and charts for complex procedures like ANOVA or F-Tests in just a few clicks.
Why Statistical Functions are Essential
Using Excel's built-in statistical tools helps you move from simply describing what happened to understanding why it happened and what might happen next. It adds a layer of scientific rigor to your analysis. For instance, a marketing manager can use these tools to determine if the results of an A/B test are statistically significant, providing confidence that the outcome wasn't due to random chance.
This capability is crucial when you need to draw reliable conclusions from a sample of data. Instead of guessing, you can calculate confidence intervals for survey results, test hypotheses, and model relationships between variables, all within the familiar Excel environment.
Actionable Tips for Effective Statistical Analysis
To leverage these powerful features correctly, follow these best practices:
- Enable the Analysis ToolPak: This powerful add-in is not enabled by default. Go to File > Options > Add-ins, select Excel Add-ins from the Manage dropdown, and check the box for Analysis ToolPak.
- Understand Your Assumptions: Before applying a statistical test like a t-Test or ANOVA, make sure you understand the underlying assumptions (e.g., normality, independence of data). Misapplying a test can lead to incorrect conclusions.
- Use Descriptive Statistics First: Before running complex tests, use the Descriptive Statistics tool in the Analysis ToolPak to get a quick summary of your data, including mean, median, standard deviation, and range.
- Combine with Conditional Formatting: After running your analysis, use conditional formatting to visually highlight outliers or significant results identified by your statistical tests, making your findings easier to interpret.
8 Essential Excel Data Analysis Tips Comparison
| Feature / Technique | Implementation Complexity 🔄 | Resource Requirements ⚡ | Expected Outcomes 📊 | Ideal Use Cases 💡 | Key Advantages ⭐ |
|---|---|---|---|---|---|
| Master PivotTables for Dynamic Data Summarization | Moderate to High: Requires data prep and learning curve | Moderate: Can be memory intensive with large data | Dynamic, multi-dimensional data summaries and insights | Large datasets analysis, sales, HR, finance, surveys | Fast processing of large data, no formulas needed, dynamic updates |
| Leverage Advanced Filtering and Sorting Techniques | Low to Moderate: Setup of complex criteria can be tricky | Low: Built-in Excel feature, light on resources | Isolated data subsets with complex filter/sort logic | Data cleaning, extracting unique records, multi-criteria filtering | Quickly isolates relevant data, easy integration with Excel |
| Implement Conditional Formatting for Visual Data Insights | Low: Rule setup straightforward but can grow complex | Low to Moderate: May slow with many rules | Visual patterns, outliers, trends highlighted within data | Dashboards, KPI monitoring, project tracking, anomaly detection | Immediate visual feedback, no extra space needed, dynamic updates |
| Utilize Data Validation and Input Controls | Low to Moderate: Requires upfront setup of rules | Low: Minimal processing impact | Controlled, consistent, error-reduced data entry | Data entry forms, maintaining data integrity, preventing errors | Prevents errors at source, improves data quality, guided user input |
| Master Dynamic Array Formulas and XLOOKUP | Moderate to High: New functions with learning curve | Moderate to High: May impact performance on large data | Flexible, scalable data extraction and lookup solutions | Dynamic reports, auto-expand lists, complex lookups | Intuitive formulas, automatic resizing, replaces complex nested formulas |
| Create Interactive Dashboards with Slicers and Charts | High: Design and setup intensive | Moderate to High: Can slow with complex data | Interactive, comprehensive data views for stakeholders | Executive reporting, project tracking, multi-metric visualization | Self-service analytics, engaging visuals, dynamic filtering |
| Implement Power Query for Data Transformation | Moderate to High: Learning M language optional but advanced | Moderate: Efficient with large data but can slow | Cleaned, transformed, consolidated data ready for analysis | ETL tasks, multi-source data integration, automation of data prep | Handles messiness, automatable, no coding needed for basics |
| Apply Statistical Functions and Analysis ToolPak | Moderate: Requires statistical knowledge | Low to Moderate: Built-in add-in with minor overhead | Detailed statistical analysis and hypothesis testing | Business stats, quality control, scientific analysis | Comprehensive stats tools, no extra software, integrates with Excel |
From Tips to Transformation: Your Next Steps in Excel
We have journeyed through a powerful collection of Excel data analysis tips, moving from foundational pillars to advanced, transformative techniques. You have seen how tools like PivotTables and Conditional Formatting are not just features but lenses through which you can view your data with greater clarity. By mastering these essentials, you build a solid bedrock for more complex analysis, ensuring your foundational skills are robust and reliable.
But the journey doesn't end with the basics. We also explored the modern evolution of Excel, highlighting the game-changing power of Dynamic Array formulas, the efficiency of Power Query for data automation, and the superior flexibility of XLOOKUP over its predecessors. These are the tools that separate the proficient user from the true data professional, turning hours of manual work into minutes of automated, repeatable processes. The ability to create interactive dashboards with slicers, for instance, elevates your reporting from static documents to dynamic, exploratory tools for stakeholders.
Bridging the Gap Between Knowledge and Action
The true value of this guide lies not in reading it, but in applying it. Information alone doesn't generate insight; practice does. The transition from simply knowing about these features to mastering them requires a conscious effort to integrate them into your daily workflow.
Your next steps are crucial. Don't try to implement everything at once. Instead, identify a specific, recurring pain point in your current process and select one or two techniques from this article to solve it.
- Is manual data cleaning consuming your week? Make Power Query your next project. Start by automating one simple import and cleaning task.
- Are your reports static and difficult for others to interpret? Focus on building a small, interactive dashboard with a single chart and a few slicers.
- Struggling with complex lookups across multiple tables? Make a commitment to use XLOOKUP exclusively for your next three projects, leaving VLOOKUP behind for good.
This deliberate, focused practice is how you build analytical muscle memory. Each small victory reinforces your learning and compounds over time.
The True Impact of Mastering Excel Data Analysis
Embracing these advanced Excel data analysis tips is about more than just becoming faster. It's about changing your relationship with data. You move from being a processor of information to a driver of strategic decisions. When you can clean, analyze, and visualize data with confidence and efficiency, you free up invaluable mental bandwidth to focus on what the numbers truly mean. You can ask deeper questions, uncover hidden trends, and deliver insights that guide your organization toward better outcomes. This is how you transform Excel from a mere spreadsheet application into your personal engine for business intelligence and strategic impact.
Ready to supercharge your data analysis and automate the most complex tasks without leaving your spreadsheet? Discover how Elyx.AI can generate formulas, create Python scripts, and provide instant insights directly within Excel. Visit Elyx.AI to see how our AI-powered add-in can revolutionize your workflow today.
Reading Excel tutorials to save time?
What if an AI did the work for you?
Describe what you need, Elyx executes it in Excel.
Sign up