Your Guide to Net Promoter Score Calculation in Excel

Before you can crunch the numbers in Excel, it’s worth taking a moment to understand what Net Promoter Score actually tells you. At its core, NPS is a simple yet powerful way to gauge customer loyalty and predict future business growth. It all comes down to one key question.
The entire system is built around asking your customers: “On a scale of 0 to 10, how likely are you to recommend our company/product/service to a friend or colleague?”

Spending too much time on Excel?
Elyx AI generates your formulas and automates your tasks in seconds.
Sign up →Based on how they answer that single question, you can sort every single respondent into one of three groups. This isn't just about getting a score; it's about understanding the different mindsets within your customer base. For a closer look at what to do with this information, you can get more context on how to analyze survey data.
The Three Customer Categories
Every response you get falls into a specific group, and each one tells a different story about your business. Getting a handle on these segments is the first practical step toward calculating a meaningful NPS in Excel.
Here’s a quick reference guide to help you visualize these customer types.
| Category | Score Range | Customer Behavior |
|---|---|---|
| Promoters | 9–10 | Your biggest fans. These loyal customers actively sing your praises and bring in new business. |
| Passives | 7–8 | They're satisfied, but not wowed. They won't complain, but they could easily be tempted by a competitor. |
| Detractors | 0–6 | Unhappy customers. They're at risk of leaving and might share their negative experiences with others. |
Understanding these categories is crucial because the NPS formula is designed to highlight the extremes of customer sentiment.
The final score comes from a straightforward calculation: you subtract the percentage of Detractors from the percentage of Promoters. Notice that the Passives are left out of the equation entirely. This is intentional.
By focusing only on your most passionate advocates and your most significant critics, you get a clear, unfiltered signal of customer loyalty. The resulting score, which can range anywhere from -100 to +100, gives you an immediate snapshot of your brand's health in the eyes of your customers.
How to Prepare Your NPS Data in Excel
Before you can even touch a formula, you need clean, well-organized data. A solid Net Promoter Score hinges entirely on how you structure your raw survey responses in Excel. It’s like prepping your ingredients before cooking; get this part wrong, and the final dish will be a mess.

Of course, the best way to get clean data is to start with a good collection method. When you're choosing customer feedback management software, look for tools that export data in a simple, spreadsheet-friendly format. This saves a ton of manual work later.
Once you have your responses, resist the urge to build a complicated spreadsheet. A simple, clean layout is always your best friend. All you really need to get started is a basic table with three essential columns.
Setting Up Your Data Template
Let's say you run a SaaS company and just got back 500 survey responses. Your first job is to get that raw feedback into a format that's ready for analysis.
I've found this simple structure works every time:
- Column A – Respondent ID: Give each respondent a unique number, like 1001, 1002, and so on. This makes it easy to track individual responses and spot duplicates without messing with personal data.
- Column B – Score: This is where the actual 0-10 rating from each customer goes. It’s the heart of your calculation.
- Column C – Feedback: Dedicate this column to any open-ended comments. While you won't use this for the NPS formula, this qualitative data is pure gold for understanding why people gave the score they did.
This straightforward setup keeps your data tidy and makes it incredibly easy for Excel’s formulas to do their job without errors.
Key Takeaway: The time you spend preparing your data directly impacts how reliable your NPS score is. A messy spreadsheet almost guarantees an inaccurate result, which can send you chasing the wrong problems.
Essential Data Cleaning Steps
With your data neatly organized, it's time for a quick cleanup. This crucial step ensures that stray entries don't throw off your entire calculation. If you want a deeper dive, our guide on how to clean data in Excel covers this in more detail.
For now, just focus on two big culprits: duplicates and blanks.
Blank responses should be removed entirely. Otherwise, they can trip up functions like COUNT and give you a false total. Duplicates, which often happen when a user accidentally submits a form twice, can seriously inflate your numbers and must be deleted to keep your data honest.
Getting Your Hands Dirty with the NPS Formula in Excel
Alright, your data is prepped and organized. Now for the fun part: actually calculating your Net Promoter Score. You don't need any complicated macros or third-party add-ins for this. It all comes down to a few core Excel functions. We'll build this calculator from the ground up, starting with simply counting your customer groups.
This handy infographic breaks down the formula we're about to put into action in our spreadsheet.
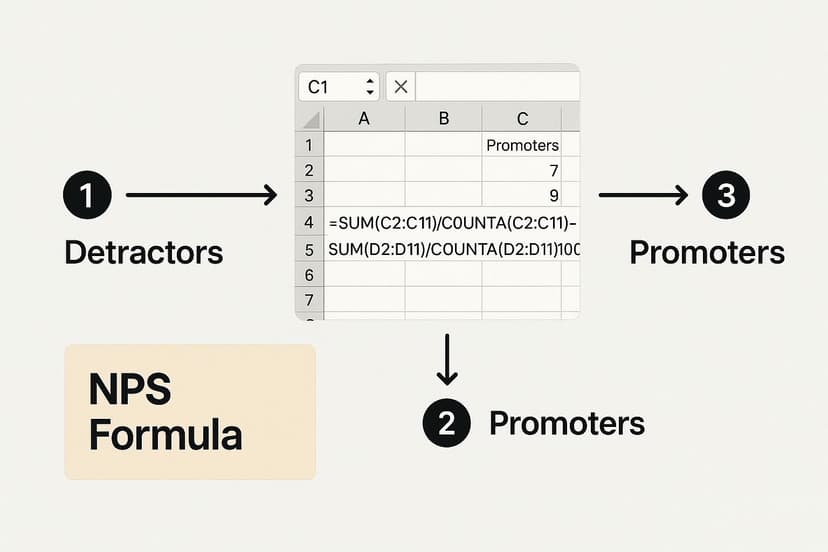
As you can see, it's all about figuring out the percentage of your audience that are Promoters and Detractors, then finding the difference.
Tallying Up Promoters, Passives, and Detractors
First things first, you need to count how many people fall into each of the three buckets. The perfect function for this is COUNTIF. It's a simple tool that just looks at a range of cells and counts how many of them match the criteria you give it.
Let's say all your scores are sitting in column B, from cell B2 down to B501. Here are the formulas you'll need:
- Detractors (Scores 0-6):
=COUNTIF(B2:B501, "<=6") - Passives (Scores 7-8):
=COUNTIF(B2:B501, "=7") + COUNTIF(B2:B501, "=8") - Promoters (Scores 9-10):
=COUNTIF(B2:B501, ">=9")
I'd recommend popping these into separate cells—say, E2, E3, and E4—to keep everything neat. The best part? As you add more survey responses to column B, these counts will update in real-time. No manual recounting needed.
Turning Counts into Percentages
Once you have the raw counts, the next step is to figure out what percentage of the total each group makes up. This is a critical step before you can get to the final NPS calculation.
You'll need the total number of responses first. The COUNT function makes this easy. In a cell like E5, just type: =COUNT(B2:B501).
Now, you just divide each group's count by that total. For example, if your Promoter count is in cell E4 and your total is in E5, the formula is simply =E4/E5. Do the same for your Detractors. Don't forget to format these cells as a percentage in Excel to make the numbers easy to interpret at a glance.
A key thing to remember is that Passives are completely ignored in the final NPS formula. Their feedback is still gold for digging into the "why," but they don't factor into the score itself.
The All-in-One NPS Master Formula
While breaking it down step-by-step is great for understanding how it all works, you can also do it all in one go with a single, powerful formula. This master formula calculates the Promoter and Detractor percentages and spits out the final score in one cell.
Assuming your data range is B2:B501, here's the formula:
=((COUNTIF(B2:B501,">=9")-COUNTIF(B2:B501,"<=6"))/COUNT(B2:B501))
Just copy and paste that into any empty cell and format it as a percentage. What this formula does is count the Promoters, subtract the number of Detractors, and then divide that result by the total number of responses. You get your final Net Promoter Score instantly.
Want a Faster Way to Calculate NPS in Excel? Try AI.
While the classic Excel formula gets the job done, it can feel a bit clunky, especially when you're staring at a massive dataset. You have to write a few different functions, get all the cell ranges right, and then stitch them together. It’s not hard, but it is a process that's prone to small errors.
A much quicker route is to use an AI tool right inside your spreadsheet. An assistant like Elyx.AI, for example, can run the entire Net Promoter Score calculation for you based on a single, simple instruction written in plain English. This eliminates the manual formula-building and helps you get to the answer faster.
Instead of wrestling with nested COUNTIF functions, you just tell the AI what you need. It’s a great way to sidestep those tiny mistakes—like a typo or a wrong cell reference—that can throw off your entire result. If you just want an accurate score without the formula-building headache, this is the way to go.
Using a Simple AI Prompt
The beauty of this approach is its simplicity. You give the AI a clear set of instructions in one go, and it handles the complex parts for you. What used to be a multi-step formula process becomes a single command.
Let’s say all your customer scores are sitting in column B. You could give the AI a prompt like this:
'Based on the scores in column B, categorize each respondent in column C as "Promoter", "Passive", or "Detractor". Then, calculate the final Net Promoter Score in cell F1.'
With that one sentence, the AI will:
- Go through and categorize every single response automatically.
- Run the necessary calculations behind the scenes.
- Place the final NPS right into the cell you specified.
This is one of the biggest wins of using AI for Excel; it lets you jump straight to analyzing what the score means instead of getting bogged down in the setup. The AI takes care of the grunt work.
Ultimately, you get the same precise NPS score you would with the manual formula, but you get it in seconds. This makes it perfect for anyone who needs to run NPS reports regularly or just prefers a more intuitive way to work with data.
So, What's Your NPS Score Really Telling You?
Alright, you've crunched the numbers and have your Net Promoter Score. But what does that single digit actually mean? A score of +20 might feel a bit underwhelming on its own, but if your competitors are all sitting in negative territory, you’re actually leading the pack. The number itself is just the starting point.
The real story begins when you compare your score to industry benchmarks. Think about it: a +25 in an industry like telecommunications, which often struggles with customer satisfaction, is pretty fantastic. But in a customer-first field like retail, that same score might just be par for the course. The goal isn't just to chase a high number—it's to understand where you stand in your own arena.
Looking Beyond the Single Number
A single NPS score is just a snapshot in time. The real magic happens when you start tracking it consistently. Is your score climbing month over month? Did that new feature release cause a sudden dip? This is where a simple metric transforms into a powerful strategic guide.
As a general rule of thumb, any score above 0 is good (it means you have more happy customers than unhappy ones), a score over 20 is solid, and hitting 60 or higher is world-class. A 2025 analysis actually found that scores over 50—like those now seen in healthcare and property management—are excellent in most industries, with anything above 70 signaling that your customers are true evangelists. You can dive deeper into NPS benchmarks on merren.io to see how different industries stack up.
The most valuable goldmine of information isn't the number itself, but the comments that come with it. The feedback from your Detractors shows you exactly what's broken, while the praise from Promoters tells you what to double down on.
When you start digging into the "why" behind the score, NPS stops being a vanity metric. It becomes a living, breathing tool that can steer your product roadmap, improve your customer support, and point you directly toward what matters most for real, sustainable growth.
Common Questions About Calculating NPS in Excel
Once you’ve got your NPS formula set up in Excel, a few practical questions almost always come up. Getting a handle on these details is what separates a basic calculation from a truly valuable business metric. Let's walk through some of the things people often ask.
Why Are Passives Ignored in the Calculation?
This is probably the most common question I hear. It feels a little weird to just leave out a whole group of customers—the ones who scored you a 7 or 8—from the final number, right?
The reason is simple but powerful: the NPS formula is designed to measure the extremes of customer emotion. It zeroes in on the two groups that actively affect your growth. Your Promoters are out there acting as brand ambassadors, while your Detractors can actively poison the well with negative word-of-mouth.
Passives, by definition, are neutral. They’re satisfied but not passionate. By excluding them, the NPS score becomes a much more sensitive and volatile metric. When you turn a Passive into a Promoter, you see a direct, positive jump in your score, which gives you a clear signal that your efforts are working.
How Often Should I Calculate My Score?
There's no magic number here; it really depends on your business and your customer lifecycle. For most, calculating NPS on a quarterly basis is a great starting point. It's frequent enough to spot trends but gives you enough time to actually do something with the feedback you get.
The right cadence for you might be different:
- If you run a high-volume e-commerce store, you might want to calculate it monthly or even trigger surveys after a purchase to get real-time feedback.
- For a B2B SaaS company with long-term contracts, a quarterly or even semi-annual check-in is often plenty to gauge loyalty without bugging your customers.
The most important thing is consistency. Pick a schedule and stick to it. A single NPS score is just a snapshot; the real value comes from tracking the trend over time.
Can I Just Average the Scores Instead?
Technically, you could just take an average of all the 0-10 scores, but you'd be throwing away the most critical insights. An average score can be incredibly misleading.
Think about it this way: a company where every single customer gives a score of 5 has the same average as a company where half the customers give a 0 and the other half give a 10. The first scenario suggests widespread mediocrity. The second points to a deeply polarized customer base—a huge red flag you would completely miss with a simple average.
The net promoter score calculation is built specifically to highlight that distribution. It tells you the story of your biggest fans versus your loudest critics, capturing a level of passion that an average just can't see.
Ready to stop wrestling with formulas and let AI handle your data analysis? Elyx.AI integrates directly into your spreadsheet, turning complex tasks like NPS calculation into simple, conversational prompts. Get accurate insights in seconds and focus on what truly matters—understanding your customers. Discover what Elyx.AI can do for you.
Reading Excel tutorials to save time?
What if an AI did the work for you?
Describe what you need, Elyx executes it in Excel.
Sign up