Mastering Operational Efficiency Metrics

Operational efficiency metrics are your company's vital signs. They are the hard numbers that tell you how effectively you're turning resources—like your team's time, your cash, and your raw materials—into actual revenue and value.
Think of them as the dashboard in a pilot's cockpit. Without those gauges, you're flying blind, relying on gut feelings and guesswork. These metrics give you the critical feedback you need to navigate, adjust, and ultimately reach your destination successfully.
Understanding the Foundation of Business Performance

Spending too much time on Excel?
Elyx AI generates your formulas and automates your tasks in seconds.
Sign up →At its heart, operational efficiency is all about maximizing what you get out of what you put in. It's the skill of doing more with less, but—and this is a big but—without letting the quality of your products or services slip.
These numbers cut through the noise of daily operations. They replace vague feelings of "being busy" with a crystal-clear, data-driven picture of your company's health. You can finally see exactly where a process is getting stuck, where costs are creeping up, or where team productivity is taking a hit. That kind of visibility is the first real step toward building a more robust and profitable business.
Why You Can't Afford to Ignore These Metrics
Trying to run a business without tracking operational metrics is like setting sail without a map or a compass. Sure, you're moving, but are you headed in the right direction? Or are you sailing directly into a storm? For any company that wants to grow sustainably, good measurement isn't optional; it's fundamental.
When you start tracking the right things, the benefits become clear very quickly:
- Slash Waste: You can finally pinpoint and cut out pointless expenses, wasted materials, and clunky processes that are holding you back.
- Boost Productivity: By optimizing how work flows and how resources are used, you can get more done in the same amount of time.
- Elevate Quality: Get to the root cause of errors and defects, which naturally leads to better products and happier customers.
- Improve Customer Satisfaction: Faster delivery and higher quality aren't just internal wins; they directly create a better experience for your customers.
To truly grasp how these metrics work together, it helps to break them down into their core components. Each pillar represents a different lens through which to view your company's performance.
The Core Pillars of Operational Efficiency
| Pillar | What It Measures | Key Question It Answers |
|---|---|---|
| Time | The duration of processes from start to finish. | "How long does it take us to deliver value?" |
| Cost | The financial resources consumed during operations. | "How much does it cost us to produce our product or service?" |
| Quality | The degree to which output meets standards and customer expectations. | "Are we doing things right the first time?" |
| Throughput | The rate at which work is completed over a specific period. | "How much can we produce or deliver within a given timeframe?" |
By looking at your operations through these four pillars, you get a complete picture. You can see not just if you have a problem, but where it is and what kind of problem it is. This is what allows you to make smart, targeted improvements.
In short, operational efficiency metrics give you a solid framework for continuous improvement. They empower you to make sharp, strategic decisions that hit the bottom line, turning your day-to-day operations from a cost center into a real value driver.
The Universal Language of Business Health
While a software company and a logistics firm will track different specific numbers, the underlying principles of efficiency are the same everywhere. The pursuit of productivity, quality, and value is a universal business language.
For example, exploring strategies to improve fleet efficiency can spark ideas for just about any business, even one without a single truck. The core concepts of route optimization, fuel management, and asset utilization are just specific examples of broader efficiency principles. It's all about getting the most out of your available resources, no matter what they are.
The Most Important Metrics to Track
Now that we have a solid grasp of what efficiency means in practice, it's time to get our hands dirty with the numbers. Choosing the right operational metrics isn't about tracking every little thing; it’s about focusing on the vital few that tell the clearest story of your performance. These metrics are the narrative of your daily operations, pointing directly to where you're winning and where friction is slowing you down.
Think of it like being a chef in a busy kitchen. You wouldn't just count the number of plates leaving the pass. You'd obsess over how long each order takes, how much food is wasted, and whether the steak frites actually made it to table seven. The same idea applies to your business. Let's dig into the essential metrics that give you that same level of deep insight.
A good dashboard is your command center, turning mountains of raw data into a clear, actionable picture.
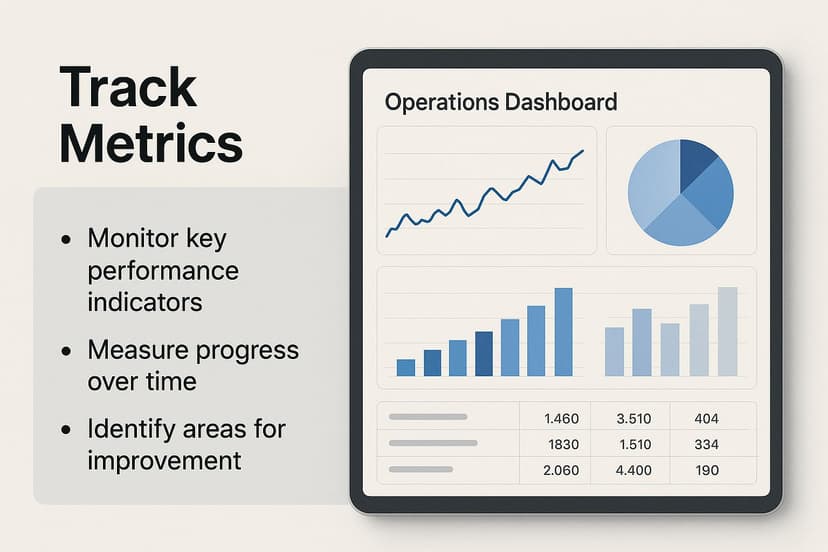
This kind of consolidated view helps you spot trends and bottlenecks at a glance, allowing for quick, data-driven decisions without drowning in spreadsheets.
Metrics for Speed and Flow
How fast you deliver value is a direct reflection of your operational health. Sluggish processes don't just frustrate customers—they inflate costs and hand your competitors a golden opportunity.
-
Cycle Time: This is the big one. It's the total time elapsed from the very start of a process to its absolute finish. For a software team, that’s from the first line of code to deployment. In a warehouse, it's the moment an order is received to the moment it's on the truck. A shorter Cycle Time almost always means happier customers and healthier margins.
-
Throughput: Where Cycle Time zooms in on a single task, Throughput zooms out to measure volume. It asks, "How many things did we get done in a set period?" Think customer support tickets resolved per day or products assembled per shift. A high Throughput shows your process can handle the heat.
-
Takt Time: This is where your production rhythm meets your customer's heartbeat. It’s a simple but powerful calculation: divide your available production time by customer demand. If you have 480 minutes in a shift and customers want 120 units, your Takt Time is four minutes. To keep up, you must finish one unit every four minutes. Simple as that.
These three are a team. If your Cycle Time for one unit is longer than your Takt Time, you have a bottleneck. You’re guaranteed to fall behind and create a backlog.
Metrics for Quality and Accuracy
Speed is useless if the final product is garbage. Shipping faulty products or delivering sloppy services creates a vicious cycle of expensive rework, reputational damage, and lost customer trust. Quality metrics are your safeguard, ensuring your drive for efficiency doesn't sacrifice excellence.
A core principle of operational excellence is that improving quality almost always improves efficiency. When you slash errors, you eliminate all the time and money wasted on fixing them. The result? A faster, leaner, and cheaper operation.
Keep an eye on these critical quality indicators:
-
First Pass Yield (FPY): This tells you what percentage of your work is done right the first time, with no need for fixes. A high FPY—often aiming for 95% or better—is a fantastic sign of a healthy, low-waste process.
-
Error Rate: Simply the inverse of FPY, this metric tracks the percentage of defective outputs. By monitoring the Error Rate, you can pinpoint exactly where in your process things are going wrong and focus your improvement efforts there.
-
Customer Satisfaction (CSAT): At the end of the day, quality is what the customer says it is. CSAT scores, Net Promoter Scores (NPS), and retention rates are all crucial operational metrics. They provide direct, unfiltered feedback on whether your "efficient" processes are actually delivering the value people expect.
Metrics for Resource Management
Finally, you have to measure how well you're using your assets—your people, your equipment, and your facilities. Wasted resources are a direct hit to your bottom line.
-
Resource Utilization Rate: This metric calculates the percentage of time a resource is actively doing productive work versus its total available time. While it's tempting to push for 100%, be careful. Over-utilization leads to employee burnout and equipment breakdowns, which can cripple your long-term efficiency.
-
Overall Equipment Effectiveness (OEE): For any business with physical machinery, OEE is the gold standard. It’s a master metric that rolls three critical factors into one score:
- Availability: Was the machine running when it was supposed to?
- Performance: Was it running as fast as it could?
- Quality: Was it making good parts, not scrap?
A world-class OEE score is considered 85% or higher. The reality is that many companies operate far below that, which just shows how much opportunity for improvement is often hiding in plain sight.
Essential Operational Metrics at a Glance
To make this even clearer, here’s a quick-reference table breaking down these core metrics.
| Metric | Formula | What It Reveals |
|---|---|---|
| Cycle Time | End Time – Start Time | The total time to complete one unit of work. Highlights process length and friction. |
| Throughput | (Total Units Produced) / (Time Period) | The capacity of a process. Shows how much work can be completed over time. |
| Takt Time | (Available Production Time) / (Customer Demand) | The required pace of production to meet customer demand. Syncs operations with sales. |
| First Pass Yield | (Units Completed Correctly) / (Total Units Started) | The percentage of work done right the first time. Measures process quality and waste. |
| OEE | Availability x Performance x Quality | A comprehensive score of manufacturing productivity, revealing hidden losses. |
| Utilization Rate | (Productive Time) / (Total Available Time) | How effectively resources (people, equipment) are being used. Balances productivity with sustainability. |
This table serves as a great starting point for building your own operational dashboard. By tracking these key numbers, you gain a multi-faceted view of your business’s health.
Of course, all these metrics are only as good as the data feeding them. To ensure your calculations are built on a solid foundation, check out these data quality best practices.
How to Turn Metrics Into Actionable Insights
Collecting operational efficiency metrics is a bit like gathering ingredients for a recipe. The numbers themselves are just raw potential; they don't become valuable until you combine them, figure out what they mean, and use them to build a clear plan. The real goal is to transform that raw data into a roadmap for smarter, faster, and leaner operations.
The first step is realizing that not all metrics are created equal. It's incredibly easy to fall into the trap of obsessing over vanity metrics—those numbers that look great on a chart but have zero connection to actual business outcomes. For instance, celebrating a huge spike in website clicks means nothing if none of those clicks are turning into sales. Real, actionable insights come from focusing on the metrics that directly impact cost, quality, and speed.

Another common pitfall is working with bad data. If your measurements are inconsistent or just plain wrong, any decision you make will be built on a shaky foundation. This is why establishing clear, standardized data collection processes isn't just a nice-to-have; it's completely non-negotiable.
From Diagnosis to Action Plan
Think of your metrics as a diagnostic tool. A doctor doesn't just glance at a single blood pressure reading and make a diagnosis. They look at it in the context of other symptoms to find the root cause of the problem. You need to do the same, looking at how your operational metrics relate to one another to piece together the full story.
Let's walk through a practical example using a metric we've already touched on: Overall Equipment Effectiveness (OEE).
A fulfillment center manager notices that her team is working incredibly hard, but they're still consistently missing shipping targets. Instead of just telling everyone to "work faster," she decides to calculate the OEE for their main conveyor belt system to find the real bottleneck.
Here’s how she breaks it down:
- Availability: The conveyor is scheduled to run for a full 8-hour shift (480 minutes). But between jams and routine maintenance stops, it was only actually operational for 420 minutes.
- Performance: The conveyor is designed to process 100 packages per minute. On this particular day, it only averaged 80 packages per minute due to slow loading and spacing issues between items.
- Quality: Of all the packages that went through the system, 2% were either damaged or misrouted and had to be processed all over again.
With this data in hand, the manager can now do a simple calculation to pinpoint exactly where the problem lies.
Calculating and Interpreting OEE
The formula for OEE is straightforward: Availability x Performance x Quality. Each of these three components is calculated as a percentage.
- Availability Score: (Actual Run Time / Planned Production Time) = (420 mins / 480 mins) = 87.5%
- Performance Score: (Actual Output / Potential Output) = (80 ppm / 100 ppm) = 80%
- Quality Score: (Good Units / Total Units) = 98%
Now, we just multiply these scores together to get the final OEE:
OEE = 87.5% x 80% x 98% = 68.6%
In most industries, a world-class OEE score is considered to be 85% or higher. A score of 68.6% is a clear red flag, but more importantly, it tells the manager exactly where to look. The biggest hit is coming from Performance (80%). The conveyor belt simply isn't running at its designed speed, even during the times it’s fully operational.
Armed with this specific insight, the manager can stop guessing and start acting. The problem isn't just random downtime; it's a systemic issue with how packages are being loaded onto the belt. This insight-driven approach paves the way for targeted solutions, like retraining staff on proper loading techniques or adjusting the belt's sensor calibration.
This is how you turn a single number into a powerful lever for real improvement. Taking raw data and shaping it into concrete insights is a core part of strong operational management. For a deeper dive into this, check out our guide on business intelligence best practices.
Using Technology to Improve Operational Efficiency
Trying to track your operational metrics with a clipboard or a jumble of spreadsheets is a surefire way to fall behind. In today's world, technology is the engine that drives real operational excellence. It helps teams shift from constantly putting out fires to proactively solving problems before they even start. Think of it as the central nervous system for your entire operation—collecting, analyzing, and serving up data in a way that’s simply impossible to do by hand.
The right tools don't just tell you what happened yesterday. They help you understand why it happened and give you a much clearer picture of what’s likely to happen next. It's this move from hindsight to foresight that gives businesses a serious competitive edge.
Creating a Single Source of Truth
One of the biggest roadblocks to better efficiency is data chaos. You know the drill: marketing has one set of numbers, sales has another, and operations has a third. This leads to endless, unproductive debates about whose data is "correct." This is precisely where integrated platforms like an Enterprise Resource Planning (ERP) system change the game.
An ERP acts as a single, unified hub for all your critical data—from inventory levels and production schedules to supply chain logistics and financials.
By creating one undisputed source of truth, an ERP eliminates data silos. Everyone across the organization works from the same playbook, ensuring that decisions are based on accurate, real-time information rather than outdated or contradictory spreadsheets.
This unified view is the bedrock for any other technological improvement you make. It ensures the metrics you're tracking are reliable, consistent, and trusted by the entire team.
Automating Repetitive and Manual Processes
Automation is a massive leap forward in streamlining how work gets done. Companies that embrace technologies like low-code platforms are seeing huge drops in the time spent on repetitive tasks, which in turn slashes human error and boosts consistency. Automating predictable, rules-based work frees up your people to focus on more strategic thinking, a trend we're seeing across every industry. You can learn more about this trend and its impact on operational efficiency from recent industry analyses.
Bringing in business process automation tools is a direct path to better efficiency by taking manual work off your team's plate. These tools can handle things like:
- Data Entry and Migration: Automatically moving information between systems, ending the soul-crushing copy-and-paste routine.
- Report Generation: Scheduling and sending out performance reports without anyone needing to lift a finger.
- Workflow Approvals: Routing documents and requests to the right people based on rules you’ve already set.
This doesn't just speed things up; it empowers your team by getting rid of the monotonous work that leads to burnout. They can then apply their real expertise to high-value activities like analysis, planning, and talking to customers. For a deeper dive into how this works in a specific area, check out our guide on financial reporting automation.
Leveraging AI and Predictive Analytics
Going beyond simple automation, Artificial Intelligence (AI) and predictive analytics are pushing operational management to a whole new level. These advanced systems don't just report on the past; they dig through historical data to spot patterns and forecast future outcomes with stunning accuracy.
Imagine your supply chain manager getting an alert that a key supplier is at high risk of a delivery delay—weeks before it's scheduled to happen. An AI model made this prediction by analyzing weather patterns, port congestion, and past performance. This gives the manager plenty of time to line up a backup, preventing a stockout that would have otherwise shut down production.
This predictive power is completely changing how businesses handle operational challenges. Instead of just reacting to disruptions, they can see them coming and sidestep them entirely. AI-powered tools like Elyx.AI can plug directly into familiar programs like Excel, letting teams analyze complex data and pull out predictive insights without needing a data science degree. This makes smarter, forward-looking decisions accessible to everyone, boosting both efficiency and resilience.
Building a Culture of Continuous Improvement
Tracking operational efficiency metrics is only half the battle. You can have the most sophisticated dashboards and detailed spreadsheets in the world, but they're useless if they don't actually inspire action. True operational excellence comes from the human side of the equation—building a team that is genuinely obsessed with getting a little bit better, every single day.
This is where data meets culture. Great metrics tell you what is happening. A great culture empowers your team to understand why it's happening and to take ownership of the solution. It’s all about shifting the company mindset from "this is how we've always done it" to "how can we do this better tomorrow?"
Fostering a Data-Driven Mindset
Creating a culture that lives and breathes continuous improvement starts with making data accessible and understandable for everyone. When metrics are locked away in executive reports, they feel like a tool for judgment. But when they're shared openly on visual dashboards for the whole company to see, they become a tool for collaboration.
Leaders have to champion this transparency. By regularly talking about key metrics in team meetings and clearly tying them to company-wide goals, you give people vital context. This helps every team member see how their individual work—like shaving seconds off a production line's cycle time or improving the first-pass yield on a project—directly contributes to the bigger picture.
The goal is to make data a shared language, not a weapon. When a metric dips, the conversation should never be about blame. It should be a curious and collective, "What can we learn from this, and how do we adjust?"
This approach builds psychological safety, encouraging people to flag issues early without fear of getting in trouble. It turns problem-solving from a top-down directive into a grassroots effort, which is always more sustainable in the long run.
Empowering Teams Through Clear Goals
A data-driven culture thrives on clear, achievable goals. Vague instructions like "improve efficiency" are just frustrating and don't lead anywhere. Instead, use your metrics to set specific targets that your teams can actually rally behind.
- Set a Specific Target: Don't just say "pack orders faster." A much better goal is, "Reduce the average order fulfillment cycle time from 12 hours to 10 hours by the end of Q3."
- Provide the Right Tools: Make sure teams have the training and technology they need to track their own progress and experiment with new ways of working.
- Celebrate the Wins: Acknowledge and reward progress, not just perfection. When a team hits a milestone, celebrate it publicly. This reinforces positive behaviors and builds momentum for the next challenge.
This cycle of setting goals, tracking progress, and celebrating wins creates a powerful feedback loop. It transforms "continuous improvement" from an abstract concept into a tangible and rewarding part of daily work. To truly embed efficiency, your organization needs a culture that embraces ongoing refinement. You can explore continuous improvement frameworks to learn how to foster such an environment.
Getting Buy-In from Everyone
For this kind of culture to stick, it needs buy-in at every single level, from the front lines to the C-suite. Your frontline employees often have the best insights into process bottlenecks because they live with them every day. You need to create channels for them to share their ideas and empower them to test small improvements on their own.
At the same time, leadership has to consistently show they're committed. When executives refer to the same operational efficiency metrics in their communications and use that data to explain their strategic decisions, it sends a powerful message. It shows that the entire organization is aligned and that the effort to improve is a shared, core value—not just the latest corporate initiative.
Real-World Wins: Operational Efficiency in Action
Theory and metrics are all well and good, but nothing tells the story like seeing them make a real difference. The true power of operational efficiency metrics isn't in the spreadsheet; it's in how companies use them to solve real, costly problems. These examples show how a sharp focus on the right numbers can deliver big results, no matter the industry.
By looking at how others have succeeded, you can start to see a practical path for turning your own data into a genuine advantage. Let's dig into how three very different businesses changed their fortunes by measuring what truly mattered.
The Manufacturing Turnaround
A mid-sized automotive parts manufacturer was in a tough spot. Their production lines were running constantly, yet profits were shrinking. The problem was simple: costs were out of control, and nobody could pinpoint why. They decided to put all their focus on one key metric: Overall Equipment Effectiveness (OEE).
The initial data was a wake-up call. Their OEE score was a shocking 48%, a long way from the industry benchmark of 85%. The biggest problem wasn’t the dramatic, line-stopping breakdowns they expected. Instead, it was thousands of "micro-stops"—tiny, frequent pauses on the assembly line that had always flown under the radar.
With this new clarity, they took immediate action:
- Targeted Maintenance: They scheduled quick, routine maintenance checks specifically to fix the small issues causing the micro-stops.
- Empowered Operators: They trained their line staff to resolve minor jams on their own, cutting down the wait time for technicians.
- Visible Progress: Real-time OEE dashboards were installed on the factory floor, so every team could see the direct impact of their work.
The results were stunning. In just six months, their OEE score jumped to 75%. This intense focus led to a 22% boost in throughput—without a single new piece of equipment—and a major drop in their cost per unit.
The Logistics Game-Changer
A regional logistics company was feeling the squeeze from fierce competition and razor-thin margins. Their two biggest headaches were soaring fuel costs and a growing number of customer complaints about late deliveries. To turn things around, they focused on two critical metrics: On-Time Delivery (OTD) Rate and Fleet Asset Utilization.
Their OTD rate was stuck at 82%, and they were losing customers because of it. A deep dive into the data revealed that inefficient route planning was the main culprit, leading to wasted miles and drivers stuck in traffic. Their solution was to invest in dynamic route optimization software.
The new system used live traffic data to adjust routes in real time. By making OTD their top priority, they pushed their on-time rate to an incredible 96% in just three months. This didn't just make customers happier; it also slashed fuel consumption by 15%.
This is a classic example of a powerful principle: the metric that improves the customer experience is often the very same one that slashes your internal costs.
The SaaS Scaling Solution
Finally, let's look at a fast-growing SaaS company hitting a wall. Their customer support team was completely swamped, leading to frustratingly long ticket times and serious employee burnout. They needed to improve service quality without hiring an army of new support agents. The two metrics they chose to track were Average Resolution Time and First Contact Resolution (FCR) Rate.
Their data showed that a massive 40% of support tickets were for the same simple, repetitive questions. The fix wasn't more people; it was better tools. They built out a detailed, searchable knowledge base for customers and deployed an AI chatbot to handle the most common inquiries.
This move freed up their human agents to tackle the truly complex issues that required their expertise. The FCR rate shot up from 60% to 85%, and the average time it took to resolve a ticket was cut in half. It was a clear lesson that smarter systems, not just a bigger payroll, are the key to efficient scaling.
Common Questions About Operational Metrics
Diving into operational metrics can feel like learning a new language, and it’s natural to have a few questions. Getting a handle on the fundamentals is the best way to build a solid strategy, so let's walk through some of the most common things people ask.
Where Should I Start If I’m New to Metrics?
The biggest mistake people make when they're new to this is trying to measure everything at once. It's a surefire way to get overwhelmed and give up.
Instead, just pick one process that really matters to your business. It could be anything from fulfilling a customer order to resolving a support ticket. Map that single process out from the first step to the last.
Once you have that, choose only one or two simple operational efficiency metrics to start with. Cycle Time (how long the whole thing takes) or Throughput (how many you finish in a day) are perfect starting points. Your goal isn't perfection; it's just to get a baseline, understand the moving parts, and build from there.
A quick note: People often mix up efficiency and productivity. Productivity is about output—how many widgets you made. Efficiency is about how well you used your resources (like time and materials) to make those widgets. You can be very productive but wildly inefficient.
How Often Should We Review Our Metrics?
There's no single right answer here; it really depends on the metric and the speed of your business. A good rule of thumb is to match your review cadence to the pace of the operation itself.
Here's a simple way to think about it:
- Daily or Weekly: Use this for fast-moving, critical operations. Think manufacturing output, logistics delivery times, or help desk ticket queues. These are the things that need quick course corrections.
- Monthly or Quarterly: This is better for the bigger picture. Metrics like overall cost reduction, customer retention rates, or long-term employee productivity trends fit well here.
The key is consistency. Whatever you choose, stick to it. Regular reviews turn data into action, preventing your insights from becoming yesterday's news. It’s how you build a real culture of continuous improvement.
Ready to stop wrestling with spreadsheets and get straight to the insights? Elyx.AI plugs right into Excel, letting you ask questions in plain English, get complex formulas, and see trends in an instant. Ditch the guesswork and start making data-driven decisions. See how you can elevate your operational analysis at https://getelyxai.com.
Reading Excel tutorials to save time?
What if an AI did the work for you?
Describe what you need, Elyx executes it in Excel.
Sign up