Categorize and Classify Data with No-Code AI

Let's face it: sorting data by hand in Excel is a massive headache. It’s slow, tedious, and almost guarantees you’ll end up with inconsistencies and human error. When you need to categorize and classify a mountain of information, doing it manually just doesn't cut it anymore. The real struggle is keeping things consistent, especially when you have more than one person working on the same file.
Why Manual Data Classification Is a Thing of the Past
The old way of sorting data is fundamentally broken. Humans have been trying to bring order to chaos for centuries, from early scientific taxonomies to modern business analytics. Think about the history of medicine—developing systems to classify diseases was a monumental step forward. Those early systems in the 18th century eventually led to the International Classification of Diseases (ICD), which is now the backbone of global health statistics.

Spending too much time on Excel?
Elyx AI generates your formulas and automates your tasks in seconds.
Sign up →This drive for structure is in our DNA. But when we try to apply that same manual approach to business data in a spreadsheet, the whole process just falls apart.
The Inherent Flaws of Sorting by Hand
Picture this: you ask three different team members to sort the same 1,000 lines of customer feedback. I can almost guarantee you'll get three different versions back. This isn't because your team is incompetent; it's because the method itself is flawed.
Manual data classification is riddled with problems:
- It's wildly inconsistent. People interpret categories differently. What one person flags as a "Shipping Complaint," another might call a "Logistics Issue."
- Human error is unavoidable. Typos, missed entries, and simple burnout can quietly corrupt your entire dataset, completely undermining your analysis.
- It's painfully slow. The process can drag on for hours or even days—time that you should be spending on strategy and decision-making, not data entry.
The true cost here isn't just the wasted time. It's the bad business decisions that come from relying on messy, inconsistent data. Nailing this process is a huge part of maintaining high standards, a topic we dive into in our guide on data quality best practices.
This is exactly where no-code AI tools like Elyx.AI come into the picture. They're built to solve these specific problems, making the entire process to categorize and classify your data faster, more accurate, and perfectly consistent every single time.
Getting Your Excel Data Ready for AI Classification
Before you can let an AI work its magic, you need to get your data in order. Think of it as prepping your ingredients before you start cooking. A little bit of cleanup now ensures the AI can accurately classify your information, saving you from the headache of fixing bad results later. It's a simple rule of thumb: better input equals better output.

The good news is that this all happens right inside Excel, a space you're already comfortable with. You’re just tidying up the spreadsheet before handing it over to Elyx.AI.
The idea of structured data isn't new, of course. It's a principle that dates back to the early 1900s with statistical pioneers like Karl Pearson, who helped establish the mathematical foundations we still rely on. Their work proved that clean, organized data is the bedrock of sound judgment. You can read more about the deep history of statistics and its pioneers if you're curious.
Your Data Cleaning Checklist
To effectively categorize and classify your information, you’ll want to tackle a few common data gremlins first. These small fixes prevent major headaches down the road and give the AI a clear, understandable dataset to work with.
Here’s what I always do before running any classification task:
- Hunt Down Duplicates: Identical rows can throw off your entire analysis. Your best friend here is Excel’s built-in "Remove Duplicates" tool. It's a quick way to make sure every entry is unique.
- Deal with Blanks: Empty cells are ambiguous. You need a consistent plan. Are you deleting the row entirely? Or maybe filling the blank with a placeholder like "N/A"? The key is to pick one method and stick with it.
- Standardize Your Formatting: This one is huge. Make sure all your dates follow the same format (like MM/DD/YYYY). Also, check for inconsistencies in text, like "USA" versus "United States." Uniformity is critical.
A tip from years of wrangling spreadsheets: Watch out for tiny typos, especially in product names or locations. I’ve seen a simple “Prodct A” instead of “Product A” trick an AI into creating a whole new, unwanted category. A quick scan to catch these little errors will dramatically improve the accuracy when you categorize and classify data and save you a ton of cleanup later.
How to Categorize and Classify Data with Elyx.AI
This is where the magic happens. You’ve got your data prepped, and now it's time to let Elyx.AI do the heavy lifting right inside Excel. You can categorize and classify entire columns of information with a single, simple command—no code required.
The secret? It all comes down to how clearly you "talk" to the AI. Think of it like giving instructions to a new assistant. If you're vague, you'll get vague results. A strong, specific prompt is what gets you clean, accurate data.
Writing Your First AI Command
Let's walk through a real-world scenario. Imagine a spreadsheet with hundreds, maybe thousands, of customer feedback comments sitting in column B. Sorting that manually would be a nightmare—it would take hours, and everyone on the team would probably categorize things a little differently.
With Elyx.AI, you can knock it out in seconds.
Here’s the kind of crystal-clear command you’d use:
"Analyze the customer feedback in column B and categorize each entry as either a Product Issue, a Shipping Complaint, or a Positive Review. Place the results in column C."
This command works so well because it leaves no room for guessing. It specifies:
- What to analyze: "customer feedback in column B"
- The exact categories to use: "Product Issue," "Shipping Complaint," or "Positive Review"
- Where the output goes: "Place the results in column C"
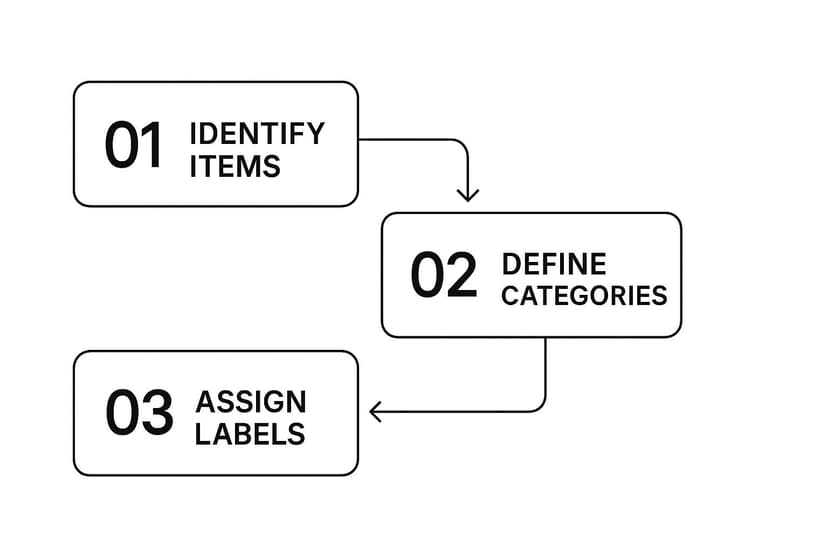
This simple flow—identifying data, defining categories, and letting the AI do the work—is the core of the process.
As you can see, the ELYX.AI() function transforms that messy raw text into neatly structured categories, all happening directly within your spreadsheet. The formula in the cell simply mirrors our plain-English instructions, and the new column populates instantly.
Mastering the Prompt for Better Results
Getting consistently great results is all about refining your instructions. The more specific you are, the better Elyx.AI can handle nuanced information. Don't be afraid to add more detail. If you have particularly complex data, you can even provide examples directly in your prompt to guide the AI.
This skill of turning natural language into data analysis is a game-changer. It’s what allows you to move beyond tedious manual tasks and start focusing on strategy. If you want to dive deeper, we cover more techniques in our guide on how to analyze data in Excel with AI.
Once you master a few simple commands, you'll find you can automate tasks that used to take up your entire afternoon. It’s all about working smarter, not harder.
Turn Your Classified Data into Business Insights
Alright, you’ve done the heavy lifting. Your raw, messy data has been whipped into shape by Elyx.AI, neatly categorized and ready for action. This is where the real value kicks in—moving from simply managing data to actually using it to make smarter decisions.
Think of it this way: those clean categories you just created are the building blocks for real business intelligence.

Now that your data is structured, you can immediately start pulling out insights using the tools you already have, like Excel's pivot tables and charts. This is the moment you stop just sorting information and start understanding what it’s telling you.
Let's go back to our customer feedback example. By dropping your newly classified data into a pivot table, you can get a quick, high-level view of what's happening. Imagine you see that "Shipping Complaints" jumped by 40% last quarter. That's not just a data point anymore; it's a red flag. It’s a signal telling you to pick up the phone and have a serious conversation with your logistics provider.
From Categories to Actionable Strategy
This is the whole point of data classification—to quickly spot trends, flag problems, and find opportunities that would otherwise be buried in a sea of text.
Here are a few practical examples of how these insights can drive smart business moves:
- Sharpen Product Development: If you see that "Product Issue" is consistently your top feedback category, you know exactly where your R&D team needs to focus its energy.
- Improve Customer Experience: A surge in tickets classified as "Billing Questions" is a strong hint that your invoices are confusing and probably need a redesign.
- Validate Marketing Efforts: Seeing a spike in "Positive Reviews" right after a new marketing campaign? That's the hard evidence you need to prove the campaign worked and justify putting more budget behind it.
The old way of doing this involved hours, or even days, of someone manually reading and tagging each entry. The difference in speed and scalability is massive.
Manual vs. AI-Powered Data Classification
Here's a quick comparison of the traditional approach versus using a tool like Elyx.AI.
| Attribute | Manual Classification | AI Classification (Elyx.AI) |
|---|---|---|
| Efficiency | Extremely slow and labor-intensive, often taking days or weeks for large datasets. | Nearly instantaneous, processing thousands of rows in seconds. |
| Accuracy | Prone to human error, fatigue, and inconsistency between different people. | Highly consistent and objective, applying the same logic to every entry. |
| Scalability | Poor. Becomes impractical and cost-prohibitive as data volume grows. | Excellent. Easily handles growing datasets without a drop in performance. |
| Insight Generation | Delayed. Insights are only available after the long manual process is complete. | Immediate. Allows for real-time analysis and rapid decision-making. |
As you can see, AI doesn't just make the process faster—it makes a level of analysis possible that simply wasn't practical before.
Key Takeaway: Turning your neatly classified data into compelling visuals is a crucial final step. These charts and graphs make your findings impossible to ignore, helping you communicate the story behind the data to your team and leadership.
To get the most out of your reports, it's worth brushing up on some proven data visualization best practices.
When you categorize and classify data with a clear goal, you give yourself the evidence needed to drive real change. You’re no longer just guessing; you’re making informed, data-backed decisions that can guide your business forward.
Getting More Out of AI Classification
Once you've got the hang of basic sorting, you can start to really push the boundaries of what's possible with AI-powered data classification. This is where you move beyond simple, one-label-per-row tasks and start tackling datasets with more nuance and complexity.
Think about customer feedback, for example. It's rarely black and white. You might get a comment that says, "I love the new features, but the app keeps crashing on my tablet." That's not just one thing—it's positive feedback and a technical bug report. A simple classification might miss that. To get a more accurate picture, you can teach Elyx.AI to handle these multi-faceted entries.
A prompt I've found effective for this is: "Read the customer feedback in column A. Assign all relevant labels from this list: 'Positive Feedback,' 'Bug Report,' 'Feature Request,' 'Billing Issue.' Put the labels in column B, separated by a comma."
Using a multi-label approach like this gives you a much richer, more honest view of your data. You can then filter and report on specific combinations, like how many bug reports also contain positive feedback.
It’s All About Granularity
This drive for more precise organization isn't new. We've been trying to classify the world around us for centuries, from Linnaeus's early biological taxonomies to Mendeleev’s elegant periodic table. The real game-changer was the arrival of computational power in the 20th century, which let us analyze massive amounts of information and build incredibly detailed models. If you're curious about the backstory, there's a great overview of the history of scientific classification on Number Analytics that shows how technology has always been the key to deeper understanding.
Handling Data at Scale
The true power of using an AI tool like this is its ability to scale. You aren't limited to just a handful of rows. You can point the AI at an entire column with thousands of entries and let it do the heavy lifting. In Elyx.AI, you just select the whole column when you set up your prompt, and it will methodically work through every single cell. It’s a massive time-saver.
A couple of hard-won tips for when you're working with large datasets:
- Process Big Jobs After Hours: If you're running a classification on 50,000 rows or more, it’s a good idea to kick it off at the end of the day. Let it run overnight so it doesn’t bog down your machine while you’re trying to work.
- Always Test First: Before you unleash your prompt on a huge file, always test it on a small sample first. I usually grab 10-20 rows to make sure the AI is interpreting my instructions correctly. This simple five-minute check has saved me hours of rework.
FAQs: What to Know Before Using AI for Data Classification
Jumping into any new tool, especially one powered by AI, naturally comes with a few questions. This is a good thing! It's smart to get a feel for how these systems handle your data before you start using them to categorize and classify sensitive information.
Let's talk about the biggest one first: data security. With a tool like Elyx.AI, your data is handled with end-to-end encryption. The AI processes your request and then it's gone—nothing is stored. This means all your confidential information stays right where it belongs: in your Excel file.
How Accurate Is It, Really?
Accuracy is always a hot topic. The truth is, the AI's performance is a direct reflection of your input. Think of it this way: the cleaner your data and the clearer your instructions, the better the results. A well-written prompt will deliver a level of consistency that’s incredibly difficult to match with manual sorting, especially after a long day of staring at spreadsheets.
But what happens when you have data that's a bit tricky or doesn't fit a simple label?
That’s where a descriptive prompt makes all the difference. You can teach the AI your specific business logic by including examples. For instance, try something like: "Categorize these support tickets into Tier 1 (Password Resets, UI Questions) or Tier 2 (Billing Discrepancies, API Failures)."
This gives the AI the context it needs to understand the subtle differences in your data. Will it be perfect every single time? Maybe not on the first go. But the goal here is to automate 99% of the tedious work. You can always refine your prompt or manually tweak a rare outlier, which is still a massive time-saver.
Ready to stop sorting and start strategizing? Transform your Excel workflow with Elyx.AI and see how easy it is to categorize and classify your data in seconds. Try it for free today!
Reading Excel tutorials to save time?
What if an AI did the work for you?
Describe what you need, Elyx executes it in Excel.
Sign up