How to Build Financial Models in Excel: A Step-by-Step Guide

Building a financial model is about more than just crunching numbers; it's about telling a company's financial story using Excel with AI. The process involves defining the model's purpose, gathering historical data, structuring the workbook logically, and then linking the three core financial statements—the income statement, balance sheet, and cash flow statement—so they dynamically interact.
Setting the Stage for a Powerful Model

Before you even open Excel, it's critical to remember what a financial model really is. It’s not just a spreadsheet. It’s a dynamic tool that tells a story about a business's future, built to answer specific questions and drive big decisions. The best models aren't the most complicated ones—they're the clearest and most logically built.
Spending too much time on Excel?
Elyx AI generates your formulas and automates your tasks in seconds.
Sign up →Instead of hunting for a generic template, think first about the why behind your model. When you understand the purpose, you can build a tool that’s both flexible and trustworthy. This mindset is what turns a simple spreadsheet into an indispensable guide for making smart moves, whether you're chasing investment or mapping out your next quarter.
There's a reason these skills are so valuable. The financial modeling and valuation industry is expected to explode, growing from $7.8 billion in 2025 to $15.0 billion by 2032. Companies need people who can build models that handle complex what-if scenarios, and that demand isn't slowing down.
Choosing the Right Model for Your Goal
The very first decision you need to make is what type of model to build. Different models answer different questions, and picking the right framework from the get-go will save you a world of headaches later on.
Here are the heavy hitters you’ll run into most often:
- Three-Statement Model: This is the foundation of everything. It links the income statement, balance sheet, and cash flow statement, giving you a complete picture of a company’s financial health. It’s your go-to for internal planning and operational check-ups. You can get a feel for the key components by checking out a solid financial projections template.
- Discounted Cash Flow (DCF) Model: When you need to figure out what a company is worth, this is your tool. A DCF model forecasts future cash flows and then discounts them back to today's value. It’s the bread and butter for investors and analysts sizing up an opportunity.
- Leveraged Buyout (LBO) Model: This one’s a different beast entirely. It’s used to see if a company can be bought using a lot of debt. The model is laser-focused on debt repayment schedules and the potential returns for private equity investors.
A great model doesn’t just answer questions—it anticipates them. The simplicity of its structure should allow for maximum flexibility, making it a product of true craftsmanship rather than just complex calculations.
Your Objective Defines Your Structure
What you’re trying to accomplish dictates every single choice you'll make.
Are you building a model for a startup’s fundraising pitch? Then you’ll be obsessed with revenue growth, customer acquisition costs, and cash burn. The whole point is to tell a convincing story that gets investors excited.
On the other hand, if you're building a model for an established company's annual budget, your world revolves around departmental spending, operational efficiencies, and comparing performance to last year. The model will be much more detailed and built for an internal audience. Getting this right from the start is the most important step toward building a model that actually gets used.
Laying the Groundwork: How to Design a Model That Lasts

Here's a simple test for a great financial model: can you hand it to a colleague and have them understand it without a two-hour lecture? If the answer is yes, you've succeeded.
Think of yourself as an architect, not just a number-cruncher. You’re drawing up the blueprint for a financial structure, and every connection needs to be crystal clear before you start laying bricks. This planning phase is what separates a professional-grade tool from the dreaded "spaghetti model"—a tangled mess of formulas that no one, including your future self, can untangle.
The goal isn't just to get the right answer; it's to build a model that inspires confidence through its structure. That means ditching the single, chaotic worksheet and embracing a clean, organized layout. Separating your workbook into dedicated sheets isn't just about being tidy; it's a fundamental best practice for building a robust and auditable model. When your assumptions are isolated, running different scenarios becomes a breeze. When your outputs are on their own sheet, stakeholders can find what they need in seconds.
The Three-Sheet Foundation
At the very least, every solid financial model is built on three core worksheets. This isn't some arbitrary rule; it's an industry standard because it creates a logical flow of information that’s intuitive and easy to debug.
Here's the basic setup I always start with:
- Inputs / Assumptions: This is your control panel. Every key driver for the model lives here—growth rates, inflation, tax rates, you name it. A golden rule of modeling is to never hard-code a number inside a formula. Every assumption belongs on this sheet.
- Calculations / Engine: This is where the magic happens. This sheet pulls all the variables from your Inputs sheet and houses the formulas that build out your three financial statements (P&L, Balance Sheet, and Cash Flow). All your supporting schedules, like debt and depreciation, live here too.
- Outputs / Summary: Think of this as the executive dashboard. It’s where you present the key findings in a clean, digestible format. This sheet is all about charts, graphs, key ratios, and summary tables that tell the financial story at a glance.
Sticking to this structure means that if you need to change a core assumption—say, bump revenue growth from 5% to 7%—you only change it in one cell on the Inputs sheet. The update then ripples through the entire model automatically. No frantic hunting for buried numbers.
The simplicity and clarity of a financial model are directly proportional to the time and thought invested in its design. A well-structured model doesn't just answer questions; it anticipates them, making complex financial decisions easier to trace and defend.
Good Formatting Is Not Optional
Beyond the sheet structure, simple formatting habits can make a world of difference. These little details are what separate amateur models from professional ones, and they make your work instantly easier to follow. The single most impactful habit you can adopt is a consistent color-coding system.
By creating a simple visual language, you remove all ambiguity about where a number is coming from.
| Cell Color | Meaning | Example |
|---|---|---|
| Blue Font | Hard-coded inputs or assumptions | A cell containing the number "2.5%" for the inflation rate. |
| Black Font | Formulas and calculations | A cell with the formula =SUM(A1:A10). |
| Green Font | Links to other worksheets | A cell pulling a value from your Inputs sheet. |
This makes it incredibly easy to trace dependencies and spot errors. For more specialized models, like those dealing with profit distributions, digging into a detailed waterfall financial model guide can give you an even more specialized framework.
By committing to these foundational design principles, you're building more than a spreadsheet. You're creating a powerful, scalable, and trustworthy analytical tool.
Building and Linking the Three Core Statements
Now that you've got the blueprint for your model, it's time to lay the foundation. This is where we get into the nuts and bolts of building the three core financial statements: the Income Statement, the Balance Sheet, and the Statement of Cash Flows. Honestly, the real art isn't just creating these reports; it's weaving them together so they talk to each other.
Think of it this way: a model with disconnected statements is just a static, lifeless report. A truly powerful model is a dynamic engine. When you change an assumption in one place, you see the ripple effect across the entire business. That's what allows you to really play out different scenarios and understand the true impact of your decisions.
This infographic breaks down the basic flow for an Income Statement, which is almost always where you'll start.
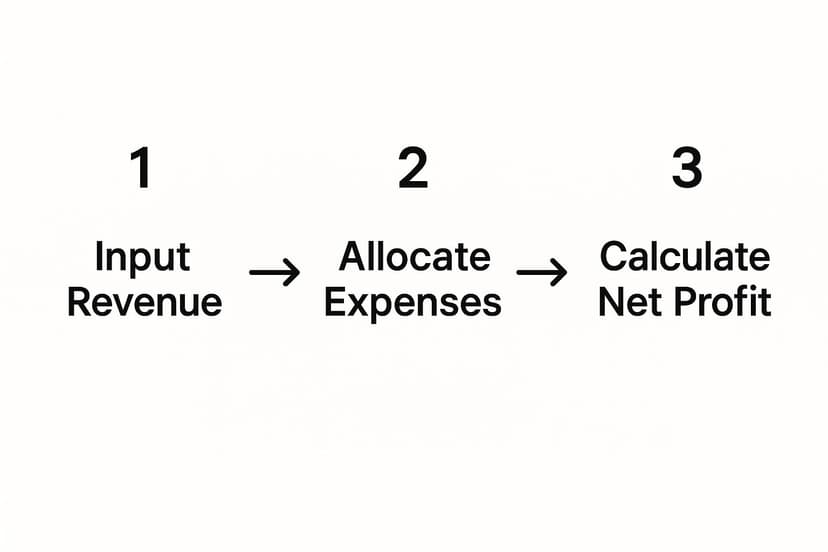
As you can see, revenue drives everything. From there, you subtract your costs to land on that all-important net profit figure.
Starting with the Income Statement
The Income Statement—often called the Profit and Loss or P&L—is the logical starting point. It tells the story of a company’s profitability over a specific period, like a quarter or a year. You begin at the top line with revenue and work your way down, subtracting every cost until you hit the bottom line: Net Income.
Let’s use a simple e-commerce startup as an example.
- Revenue Forecast: First, you’d project sales. This isn't just pulling a number out of thin air; it’s a detailed buildup. You might forecast the number of units you expect to sell each month and multiply that by your average selling price.
- Cost of Goods Sold (COGS): Next, you subtract the direct costs of making or acquiring those products. This calculation gives you the Gross Profit, a critical metric for understanding your core product's profitability.
- Operating Expenses (OpEx): After that, it’s time to deduct the other costs of simply being in business—things like marketing campaigns, employee salaries, and rent for your office or warehouse.
- Net Income: Finally, once you account for interest and taxes, you arrive at Net Income. This single number is the heart of your model because it directly links to both the Balance Sheet and the Cash Flow Statement.
Connecting to the Balance Sheet
Next up is the Balance Sheet. This statement is a snapshot in time of what your company owns (Assets) and what it owes (Liabilities and Equity). The golden rule is that the fundamental accounting equation, Assets = Liabilities + Equity, must always, always be true. This is where a lot of people trip up when they first start building models.
The most important connection here is Retained Earnings, which is part of the Equity section on the Balance Sheet. The formula is straightforward but absolutely vital:
Retained Earnings (Current Period) = Retained Earnings (Prior Period) + Net Income (Current Period) – Dividends Paid (Current Period)
See that? The Net Income figure is pulled directly from the bottom of your P&L. This is how your company's profitability (or loss) gets reflected in its overall net worth. If your startup clears a $50,000 profit in its first year and pays no dividends, that entire amount flows into Retained Earnings, boosting the company's equity.
The All-Important Balance Check
I can't stress this enough: every professional-grade model needs a "balance check" at the bottom of the Balance Sheet. It’s a dead-simple formula: Total Assets - (Total Liabilities + Total Equity).
This cell should always show zero. If it doesn't, a link is broken somewhere, and you have to go back and find the mistake. This check is non-negotiable; it provides instant confidence to you and anyone else looking at your model that it's at least mechanically correct.
Weaving in the Cash Flow Statement
The Statement of Cash Flows is often the trickiest piece of the puzzle, but it's arguably the most insightful. It reconciles the Net Income (which is based on accrual accounting) with the actual cold, hard cash that moved in and out of your bank account. For any business, but especially a startup, cash is everything.
This statement is split into three parts:
- Cash Flow from Operations (CFO): This starts with Net Income and then adjusts for non-cash expenses (like depreciation) and changes in working capital (like inventory or accounts receivable).
- Cash Flow from Investing (CFI): Here, you track cash used for long-term assets, like buying new machinery (a cash outflow) or selling old property (a cash inflow).
- Cash Flow from Financing (CFF): This section shows cash from raising money (like a new loan) or returning it to investors (like paying a dividend).
The changes in working capital are found by comparing the Balance Sheet from one period to the next. For example, if your Accounts Receivable goes up, it means more customers owe you money—that’s a use of your cash, which you'll see reflected in the CFO section. To really get a feel for how these pieces move, you can dig into a detailed cash flow analysis template to see the mechanics in action.
Finally, you add up the cash flow from these three sections to get the net change in cash for the period. You add this change to your beginning cash balance (from last period's Balance Sheet) to get your ending cash balance. This ending cash figure then links back to the cash line item on the current period's Balance Sheet, completing the loop.
To build and link these three statements well, it's crucial to understand their purpose and compliance requirements, which are covered in-depth in this expert guide on financial statements. Getting this final, circular link right is what turns your separate reports into a fully integrated and powerful financial model.
Using AI to Sharpen Your Forecasts
Relying on simple trend lines and gut feelings to predict the future just doesn’t cut it anymore. Modern financial modeling demands a sharper edge, and that edge is now found in artificial intelligence. When you bring AI directly into Excel, you’re no longer just working with a static spreadsheet; you have an intelligent partner for forecasting.
This isn’t some niche trend, either. It’s a massive shift. AI has become a core part of financial modeling, completely changing how we work and dramatically improving accuracy. It's estimated that by 2025, a staggering 75% of financial institutions will be using AI in their modeling. This isn't just about fancy algorithms; it's about using machine learning to sift through huge datasets, flag anomalies, and run predictive scenarios with a level of precision we couldn't dream of just a few years ago. You can dig into more of the numbers behind this shift in this detailed financial modeling report.
Ultimately, this evolution takes us way beyond basic formulas. It lets you build smarter, data-driven forecasts without ever having to leave the familiar environment of your spreadsheet.
Uncovering Hidden Trends with AI
One of the toughest parts of forecasting is seeing the subtle patterns buried deep in your historical data. I’m talking about seasonality, cyclical trends, or hidden links between variables that are almost impossible to spot by hand, especially when you're dealing with mountains of information. This is where AI tools really prove their worth.
AI add-ins for Excel, like Elyx.AI, can analyze your historical sales or expense data with a simple prompt. Imagine just asking:
"Analyze our last 36 months of sales data and identify any significant seasonal patterns or growth trends."
In seconds, the AI can come back with insights you might have missed entirely. It could highlight that sales consistently jump 15-20% in Q4, or that a specific marketing campaign has a delayed but major impact on lead generation three months later. Suddenly, you can build assumptions that are far more nuanced and accurate, moving from a simplistic straight-line forecast to one that actually reflects the real rhythm of your business. If you want to see how these tools operate in practice, our guide on using AI for Excel breaks down the applications.
Generating Scenarios in Minutes, Not Hours
Every good financial model needs scenario planning. But building out your best-case, base-case, and worst-case scenarios by hand is a soul-crushing, tedious process. It usually means duplicating sheets, tweaking dozens of assumption cells, and praying you didn’t break a formula somewhere along the way.
AI changes the game here. Instead of painstakingly building these scenarios manually, you can just tell the AI what you want. Give it your base assumptions, and then ask it to create variations.
- Optimistic Case: "Create a forecast where our customer acquisition cost drops by 10% and our customer lifetime value climbs by 5% over the next two years."
- Pessimistic Case: "Model a scenario where a new competitor enters the market in Q3, causing a 15% drop in our market share over the next 12 months."
The AI can generate these alternate realities in separate tabs or tables, complete with all the adjusted financial statements. What used to take up a whole afternoon of careful, error-prone work can now be done in the time it takes to type a couple of clear sentences.
Instant Sensitivity Analysis
Sometimes you don't need a full-blown scenario. You just need to know how one single change will ripple through the entire model. That's sensitivity analysis, and it helps you answer critical questions like, "What happens to our net profit if our main raw material cost goes up by 5%?"
The old way involved changing one input cell, then hunting down all the key output cells to see what happened. It was slow and clunky. With an AI chat integrated into your spreadsheet, you can just ask the question directly.
You can highlight your net income cell and ask the AI, "Show me how this number changes if the customer churn rate assumption increases from 1.5% to 2.5%." Instantly, the AI calculates the impact and tells you that your projected net income would drop by, say, $150,000. This immediate feedback turns your model from a static report into a truly dynamic tool, letting you rapid-fire test your assumptions and make smarter strategic decisions on the fly.
How to Present Your Financial Story

Let's be honest: even the most sophisticated financial model is worthless if nobody understands it. All that brilliant analysis gets lost if you can't translate it into a story that resonates with decision-makers. This final step is where you stop being just an analyst and become a storyteller.
Your real job isn't to walk people through every tab and formula. It's to guide your audience—be it executives, investors, or your own team—to a clear, data-driven conclusion. You’re building a bridge from the complex world of your spreadsheet to the high-level decisions they need to make.
This skill is more valuable than ever. The global market for financial modeling services was pegged at USD 2.5 billion in 2023 and is on track to hit USD 5.8 billion by 2032. That's not just growth; it's a clear signal that companies are desperate for people who can turn raw data into strategic direction. You can get more details on this trend over at dataintelo.com.
Building an Executive Dashboard in Excel
The best way to tell your story is with a dedicated executive dashboard, usually built right on your 'Outputs' sheet. Think of it as the cover of your book. For a busy stakeholder, it might be the only page they read, so it has to be clean, visual, and get straight to the point.
Your dashboard is all about summarizing the most critical outputs. Focus on the key performance indicators (KPIs) that actually matter to the people in the room. Forget cramming every single data point onto one screen. Instead, hand-pick a few powerful visuals that answer the biggest questions before they're even asked.
A great dashboard doesn't show you everything; it shows you the right things. The goal is to answer 80% of your audience's questions in the first 20 seconds they look at it.
A well-designed dashboard is your visual executive summary. It sets the stage, highlights the key trends, and immediately points to the conclusions your deep-dive analysis uncovered.
Choosing the Right Chart for Your Financial Data
The charts you pick are the paragraphs of your visual story. Choose the wrong one, and the message gets garbled. Each chart type is designed for a specific job, and getting it right is fundamental to clear communication.
Here's a quick field guide to picking the right visual for the job in Excel.
| Chart Type | Best For Visualizing | A Common Mistake to Avoid |
|---|---|---|
| Line Chart | Showing trends over time, like monthly revenue or user growth. | Using it for categorical data. A line implies a connection between points that doesn't exist for distinct categories. |
| Waterfall Chart | Explaining the positive and negative contributions to a final value, like changes in cash flow or net income. | Overcrowding it with too many small items. It's most effective when highlighting a few major drivers of change. |
| Bar or Column Chart | Comparing distinct categories, such as sales by product line or expenses by department. | Making the axes unclear or starting the value axis at a number other than zero, which can distort the comparison. |
| Pie Chart | Illustrating parts of a whole, such as the percentage breakdown of a company's market share. | Including too many slices. If you have more than five or six categories, a bar chart is a much clearer alternative. |
Once you know which tool to use for which data, you can build a dashboard that communicates complex ideas with real clarity and impact.
How AI Can Craft Your Narrative
Okay, your visuals are in place. But you still need to put the key takeaways into words. This is another spot where a tool like Elyx.AI can be your secret weapon, right inside Excel. Instead of staring at a blank screen trying to write the perfect executive summary, let AI give you a running start.
Just highlight your main summary table or output data and give it a simple instruction.
- "Generate a three-bullet executive summary from this data, focusing on the revenue forecast and key risks."
- "Write a short paragraph explaining the main drivers of the projected 15% increase in net profit next year."
The AI will generate a concise, professional summary you can drop right into your presentation or email. It’s a huge time-saver and helps ensure your core message is sharp and effective, giving your financial story the impact it deserves.
Frequently Asked Questions in Financial Modeling
As you get deeper into building financial models, you're bound to hit a few common roadblocks. Everyone does. Tackling these issues head-on will save you a ton of frustration and help you create models that are not just accurate, but genuinely useful.
Here’s a look at some of the most common questions that come up.
What's the Biggest Mistake Beginners Make?
Hands down, the single biggest mistake is a messy structure. New modelers have a tendency to throw everything onto one giant worksheet—assumptions, calculations, charts, you name it. This creates what we call a "spaghetti model," and it's a nightmare to audit, update, or even explain to a colleague.
The professional standard is simple: separate everything into dedicated tabs.
- Assumptions Tab: This is where all your inputs live. Think growth rates, inflation figures, and any key business drivers.
- Calculations Tab: This is the engine room. It’s where the three financial statements are built out and linked together.
- Outputs Tab: A clean, presentation-ready dashboard with your key charts, tables, and summaries for stakeholders.
Getting into this habit from the start is probably the most important thing you can do. It keeps your work transparent, easy to scale, and dramatically reduces the chance of errors.
Do I Need to Be a Data Scientist to Use AI in My Models?
Absolutely not. You don't need a technical background to bring AI into Excel anymore. Modern tools like Elyx.AI are built for finance pros, not programmers. They plug right into your spreadsheet and work with plain English.
For instance, instead of wrestling with complex formulas, you can just ask the AI to, "forecast monthly revenue for the next 24 months, factoring in historical sales and Q4 seasonality." The AI does the heavy lifting in the background.
Think of it as having a brilliant assistant who can handle tasks like:
- Generating optimistic, pessimistic, and base-case scenarios.
- Forecasting key line items.
- Explaining what a complicated formula you inherited actually does.
- Running a sensitivity analysis instantly.
It’s all about automating the tedious parts of the job so you can spend your time thinking about what the numbers actually mean for the business.
My Balance Sheet Isn't Balancing—Where Do I Start?
It’s the classic modeling problem, and it happens to everyone. The key is to be systematic, not frantic. The very first thing you need is a "balance check" cell at the bottom of your balance sheet. The formula is simply Total Assets - (Total Liabilities + Equity). This number must always be zero.
When that balance check is off, don’t panic. The issue is almost always a broken link between the statements. Finding it is just a matter of tracing the flow of cash.
If your check isn't zero, here are the three most likely culprits to investigate, in this order:
- Net Income to Retained Earnings: This is the big one. It's incredibly common to forget to link the Net Income from the bottom of your Income Statement into the Retained Earnings calculation on the Balance Sheet.
- Depreciation and PP&E: Check that your cumulative depreciation is flowing correctly from your depreciation schedule and reducing your gross Property, Plant, & Equipment (PP&E) balance.
- Financing Activities: Make sure changes in debt and equity are hitting both sides of the equation. If the company takes on new debt, for example, your cash (an asset) and your debt (a liability) should both increase by the exact same amount.
Walking through these critical links methodically will almost always uncover the problem, getting your model back on track and ready for analysis.
Ready to stop wrestling with complex formulas and start getting instant insights? Elyx.AI integrates directly into Excel, allowing you to generate forecasts, summarize data, and build scenarios with simple text commands. Transform your spreadsheet workflow with AI today.
Reading Excel tutorials to save time?
What if an AI did the work for you?
Describe what you need, Elyx executes it in Excel.
Sign up